Open Access
Fig. 7.
Download original image
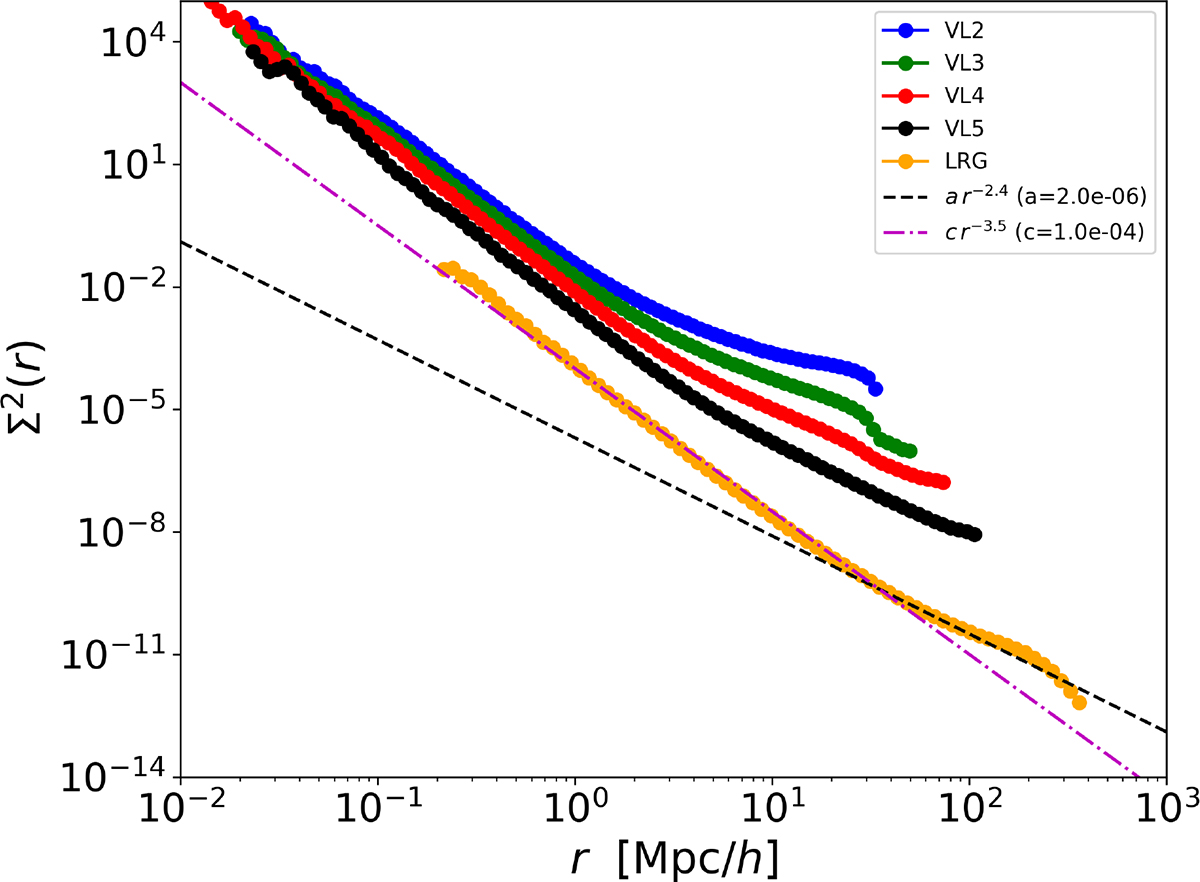
Variance Σ2(r) measured in the region R25 for the four VL subsamples (VL2, VL3, VL4, and VL5) extracted from the BGS, and for the LRGS sample (R25). Two reference lines proportional to r−3.5 and r−2.4 are shown.
Current usage metrics show cumulative count of Article Views (full-text article views including HTML views, PDF and ePub downloads, according to the available data) and Abstracts Views on Vision4Press platform.
Data correspond to usage on the plateform after 2015. The current usage metrics is available 48-96 hours after online publication and is updated daily on week days.
Initial download of the metrics may take a while.