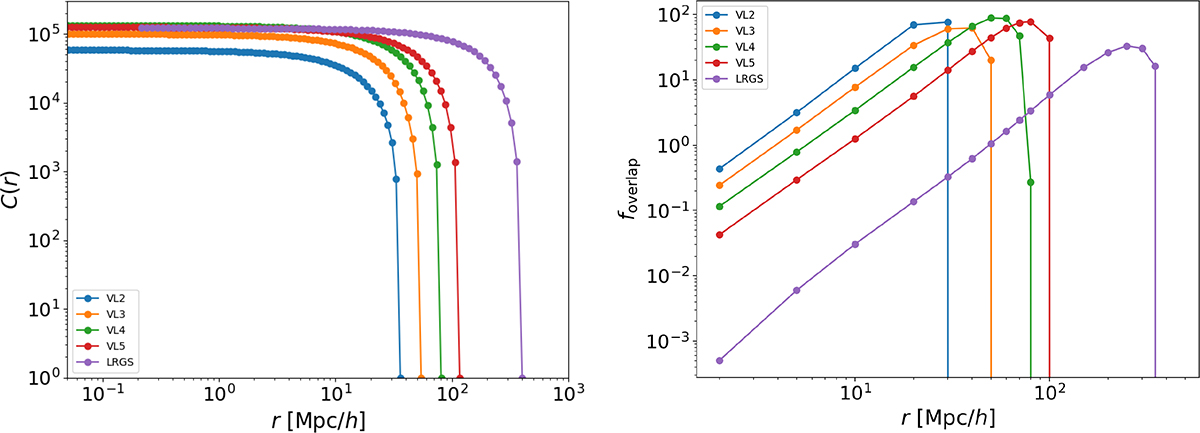
Fig. 9.
Download original image
Controlling finite-size effects. Left panel: Behavior of the number of centers, C(r), over which the conditional density ⟨n(r)⟩ is averaged for the four samples VL2, VL3, VL4, VL5, LRGS in the same angular region R25. Right panel: Behavior of foverlap the total overlapping volume of all intersecting sphere pairs and the total volume of all spheres (see Eq. (8)) for the same samples.
Current usage metrics show cumulative count of Article Views (full-text article views including HTML views, PDF and ePub downloads, according to the available data) and Abstracts Views on Vision4Press platform.
Data correspond to usage on the plateform after 2015. The current usage metrics is available 48-96 hours after online publication and is updated daily on week days.
Initial download of the metrics may take a while.