Fig. 1
Download original image
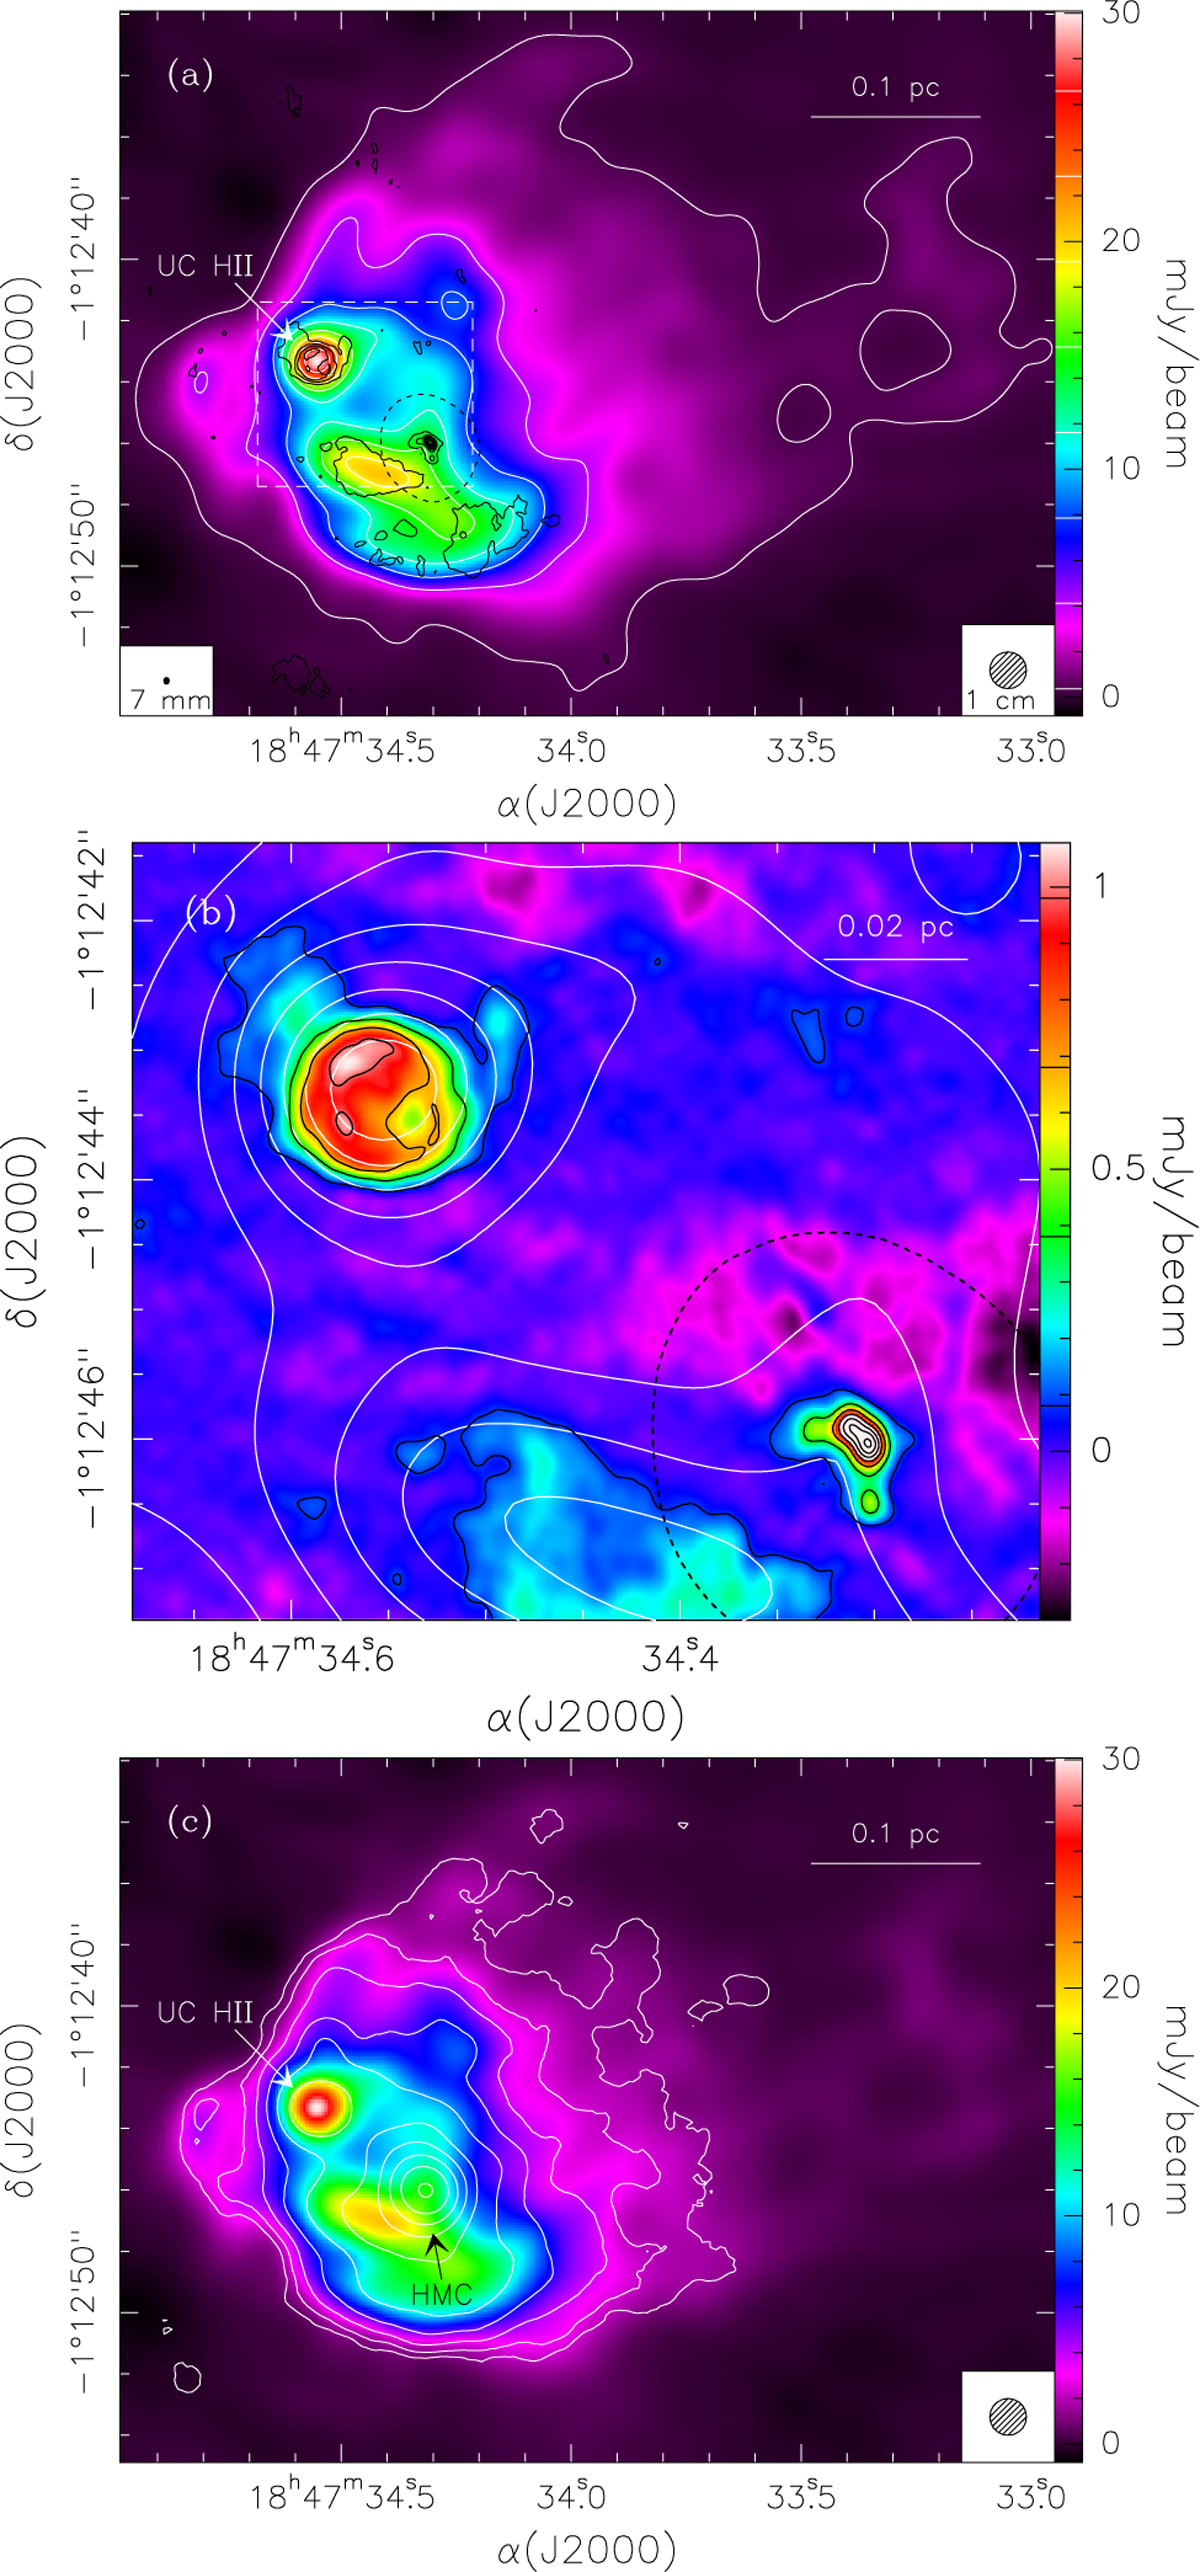
(a) Maps of the 1 cm (colour image and white contours) and 7 mm (black contours) continuum emission imaged with the VLA. The contour levels of the 1 cm map are drawn in the colour scale to the right, while those of the 7 mm map range from 0.08 to 1.88 in steps of 0.3 mJy/beam. The black dotted pattern outlines the approximate border of the HMC (see text). The dashed rectangle frames the region shown in panel b. The synthesised beams (1″.2 at 1 cm and 0″.21×0″.17 with PA −0°.5 at 7 mm) are shown in the bottom-left and -right corners. (b) Enlargement of the region that contains the UC HII region and the HMC, corresponding to the dashed rectangle in panel a. The symbols have the same meaning as in panel a, with the exception of the colour image that shows the 7 mm continuum emission. We note that the colour scale is saturated (the peak emission at 7 mm is 1.96 mJy/beam) to emphasise the structure of the UC HII region. (c) Contour map of the 3 mm continuum emission obtained from the ALMA data overlaid on the same 1 cm continuum image as in panel a. Contour levels range from 0.5 to 180 mJy/beam in ten logarithmic steps. The synthesised beam (1″.2) is the same for both maps and is shown in the bottom-right corner.
Current usage metrics show cumulative count of Article Views (full-text article views including HTML views, PDF and ePub downloads, according to the available data) and Abstracts Views on Vision4Press platform.
Data correspond to usage on the plateform after 2015. The current usage metrics is available 48-96 hours after online publication and is updated daily on week days.
Initial download of the metrics may take a while.