Fig. 11
Download original image
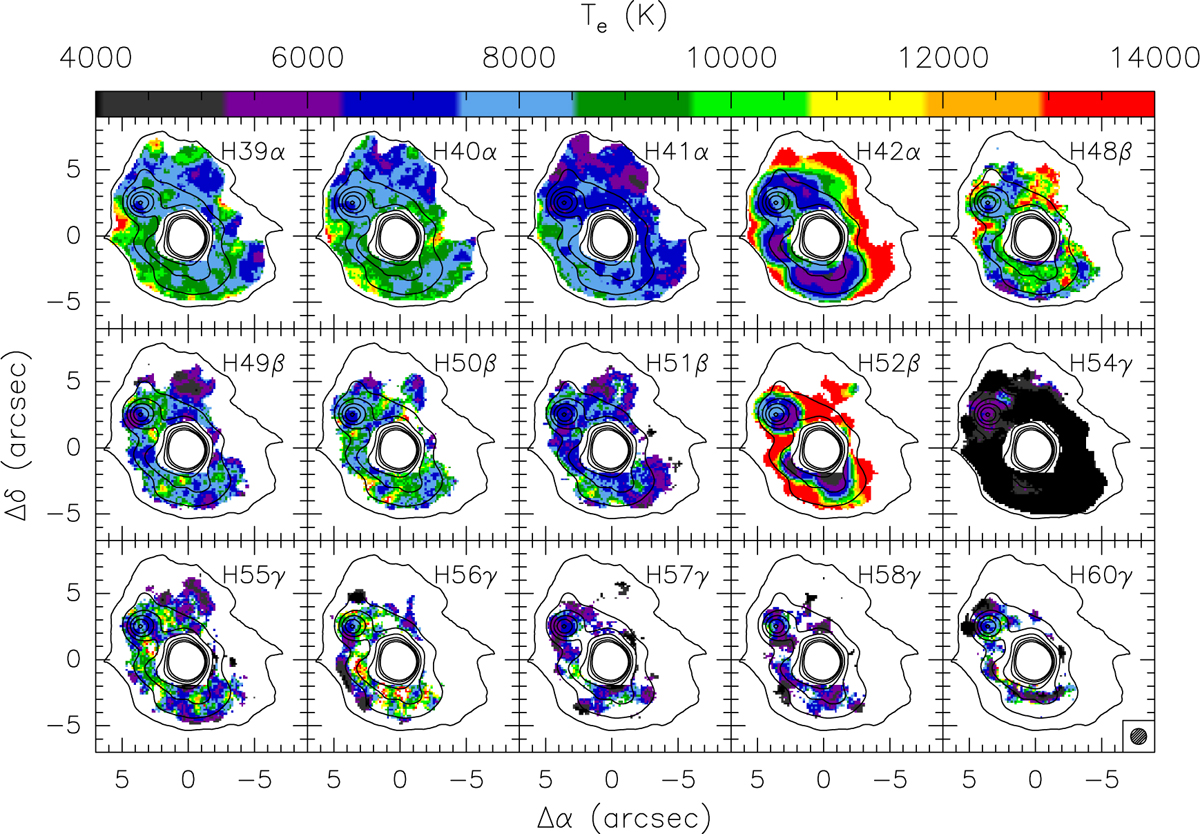
Maps of the electron temperature obtained from the hydrogen recombination lines indicated in the top right corners of the panels, under the LTE approximation. The offsets are relative to the phase centre of the ALMA observations. The contours are the map of the 3 mm continuum emission shown in Fig. 1c, with contour levels ranging from 1.15 to 28.75 in steps of 4.6 mJy/beam. The synthesised beam is shown in the bottomright corner.
Current usage metrics show cumulative count of Article Views (full-text article views including HTML views, PDF and ePub downloads, according to the available data) and Abstracts Views on Vision4Press platform.
Data correspond to usage on the plateform after 2015. The current usage metrics is available 48-96 hours after online publication and is updated daily on week days.
Initial download of the metrics may take a while.