Fig. 13
Download original image
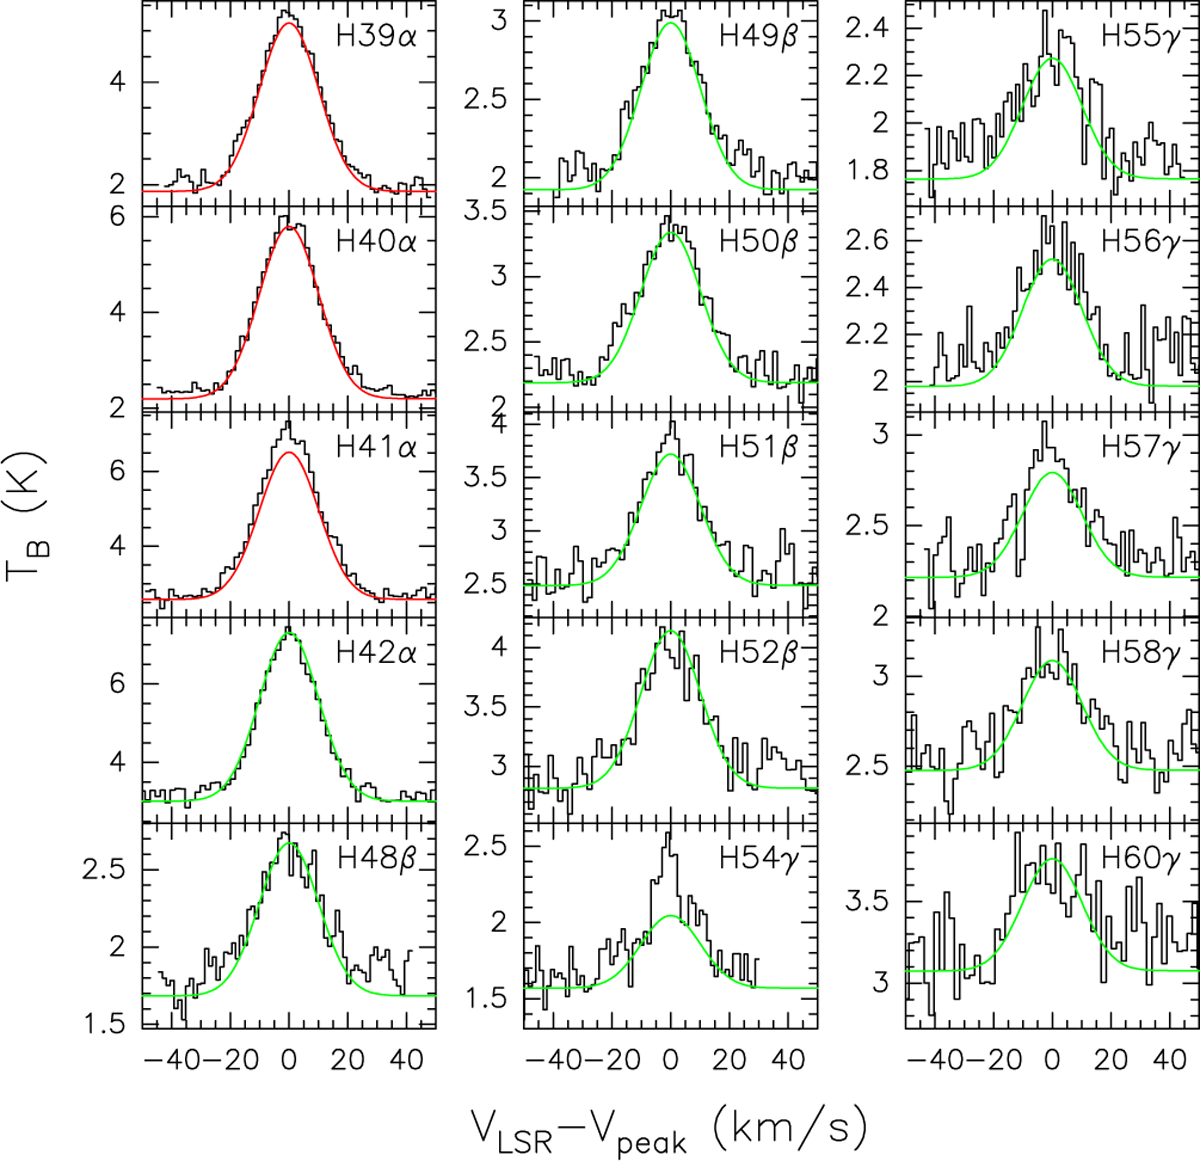
Spectra of the hydrogen recombination lines observed towards the peak of the UC HII region. The name of the line is indicated in the top right corner of each panel. The velocity is relative to the peak velocity of each spectrum, obtained with a Gaussian fit. The red and green curves are the model spectra obtained by fitting only the H39α, H40α, and H41α lines. The H54γ line is contaminated by emission from a molecular line.
Current usage metrics show cumulative count of Article Views (full-text article views including HTML views, PDF and ePub downloads, according to the available data) and Abstracts Views on Vision4Press platform.
Data correspond to usage on the plateform after 2015. The current usage metrics is available 48-96 hours after online publication and is updated daily on week days.
Initial download of the metrics may take a while.