Fig. 18
Download original image
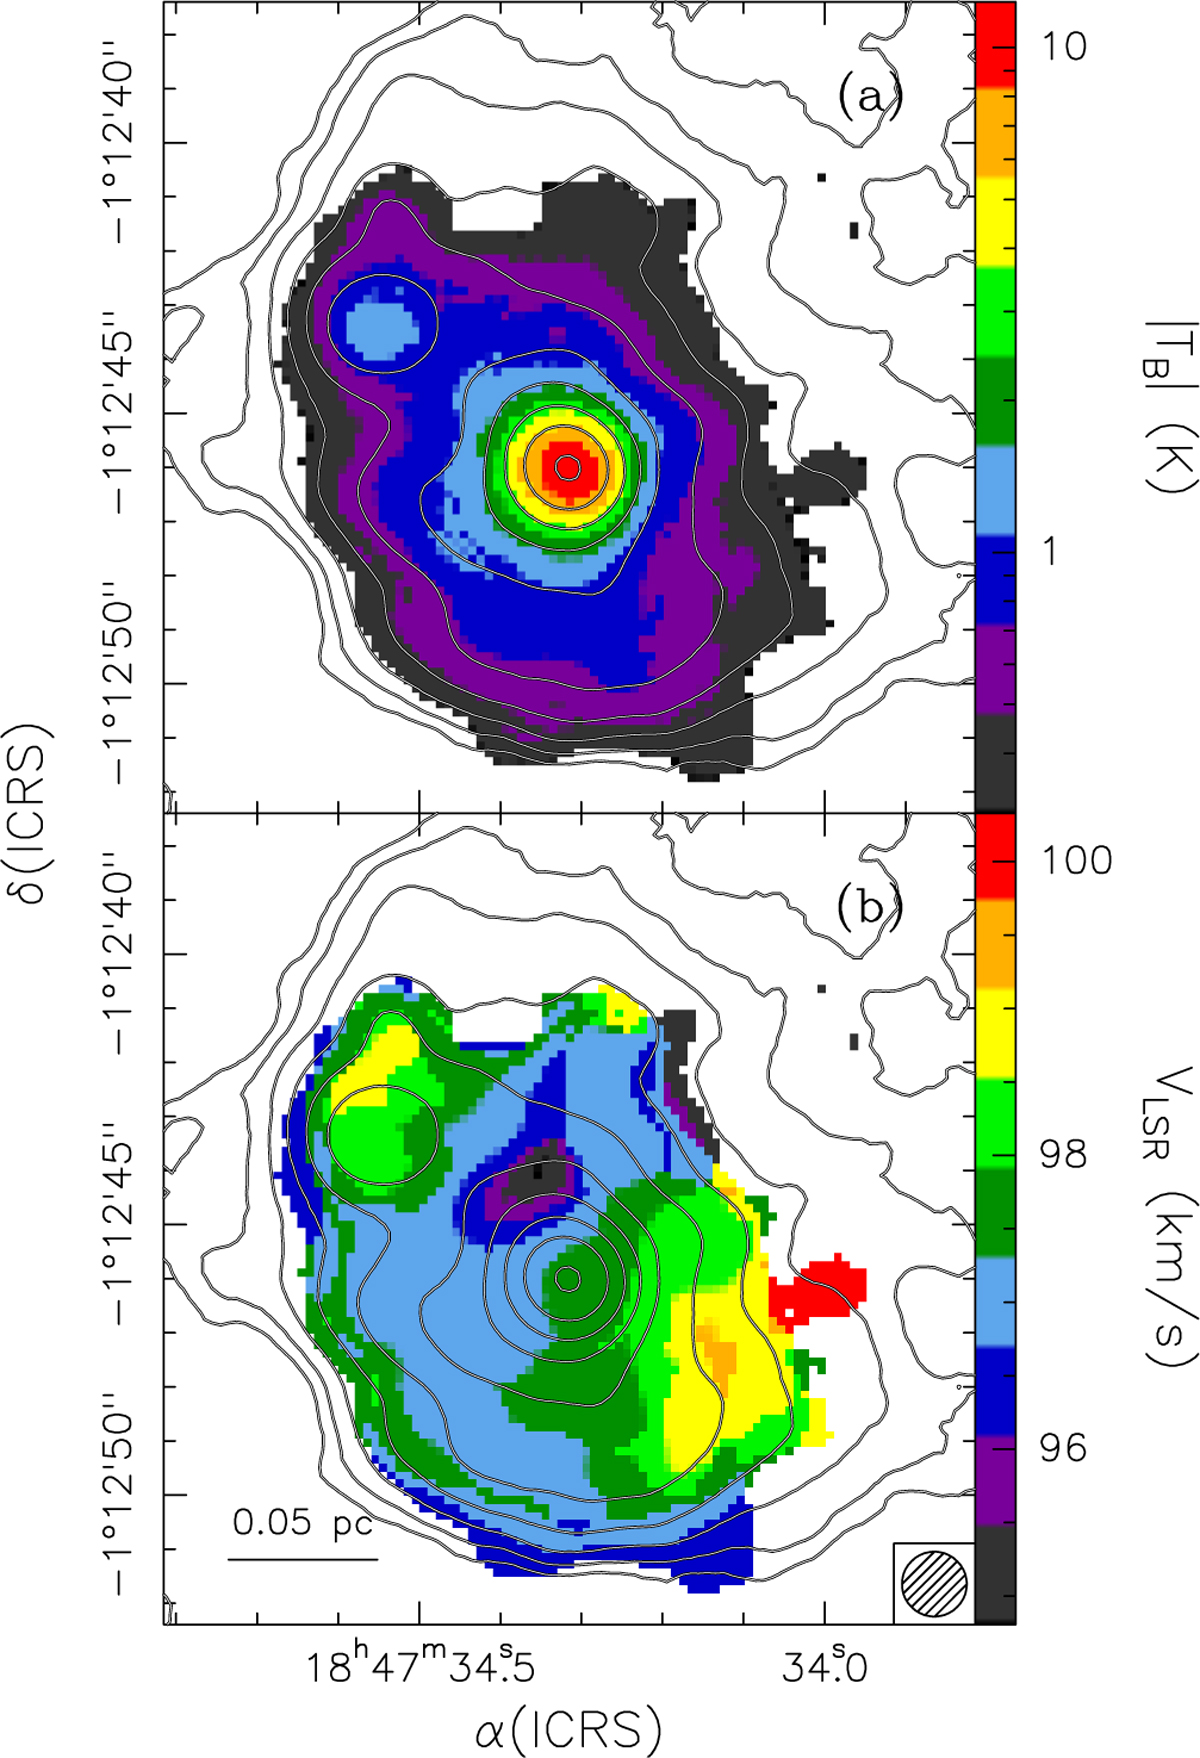
(a) Map (colour image) of the absolute value of the minimum (negative) brightness temperature of the N = 1-0, J =1/2-1/2, F=3/2-3/2 hyperfine component of the CN(1-0) line. (b) Map of the LSR velocity at which the minimum brightness shown in panel a is attained. The synthesised beam is shown in the bottom-right corner. The contour map represents the 3 mm continuum emission and is the same as in Fig. 1c.
Current usage metrics show cumulative count of Article Views (full-text article views including HTML views, PDF and ePub downloads, according to the available data) and Abstracts Views on Vision4Press platform.
Data correspond to usage on the plateform after 2015. The current usage metrics is available 48-96 hours after online publication and is updated daily on week days.
Initial download of the metrics may take a while.