Fig. 19
Download original image
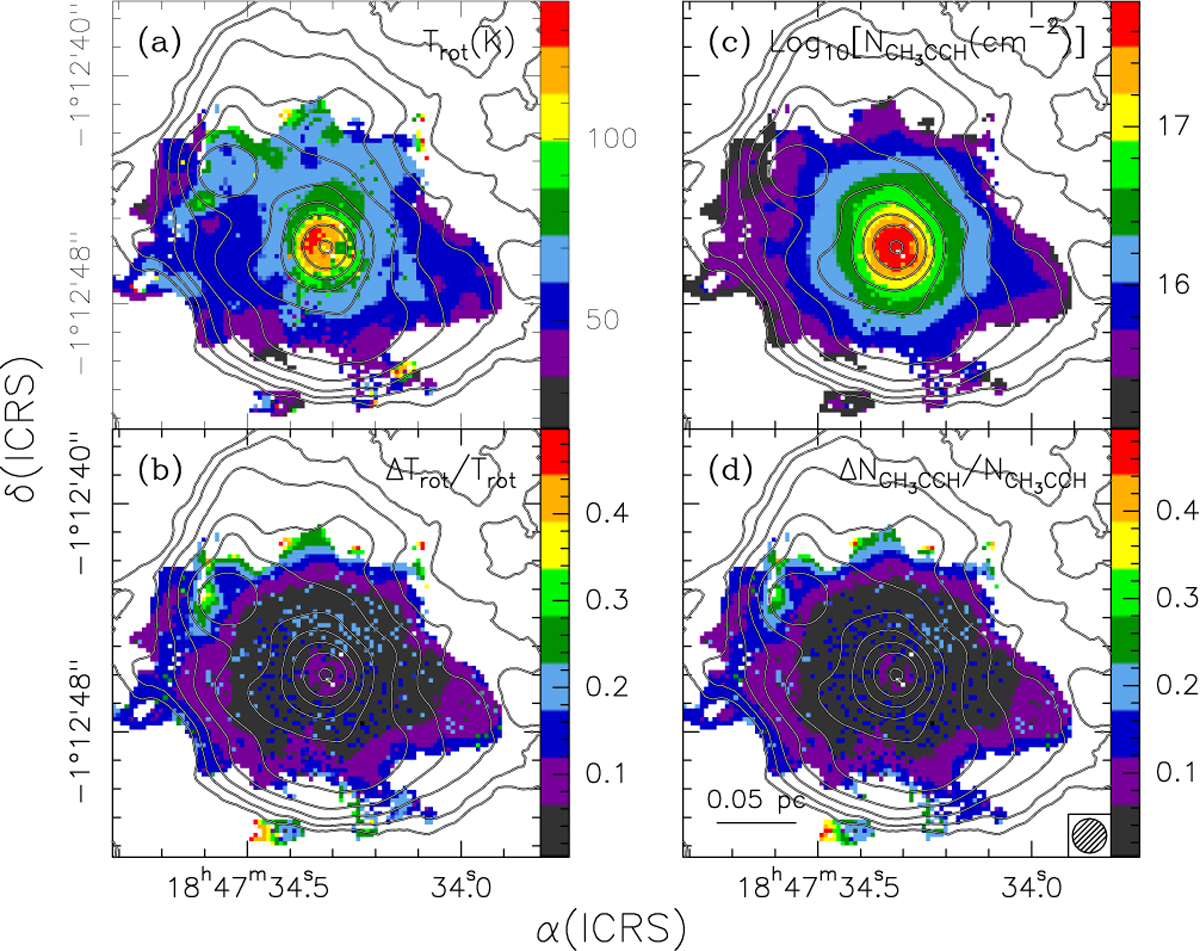
(a) Map (colour image) of the rotational temperature obtained from the rotation diagram of the CH3CCH molecule. Contours represent the same map of the 3 mm continuum emission as in Fig. 1c. (b) Map of the relative error on the rotation temperature. (c) Same as panel a, for the CH3CCH column density. (d) Same as panel b, for the CH3CCH column density. The synthesised beam is shown in the bottom-right corner.
Current usage metrics show cumulative count of Article Views (full-text article views including HTML views, PDF and ePub downloads, according to the available data) and Abstracts Views on Vision4Press platform.
Data correspond to usage on the plateform after 2015. The current usage metrics is available 48-96 hours after online publication and is updated daily on week days.
Initial download of the metrics may take a while.