Fig. 2
Download original image
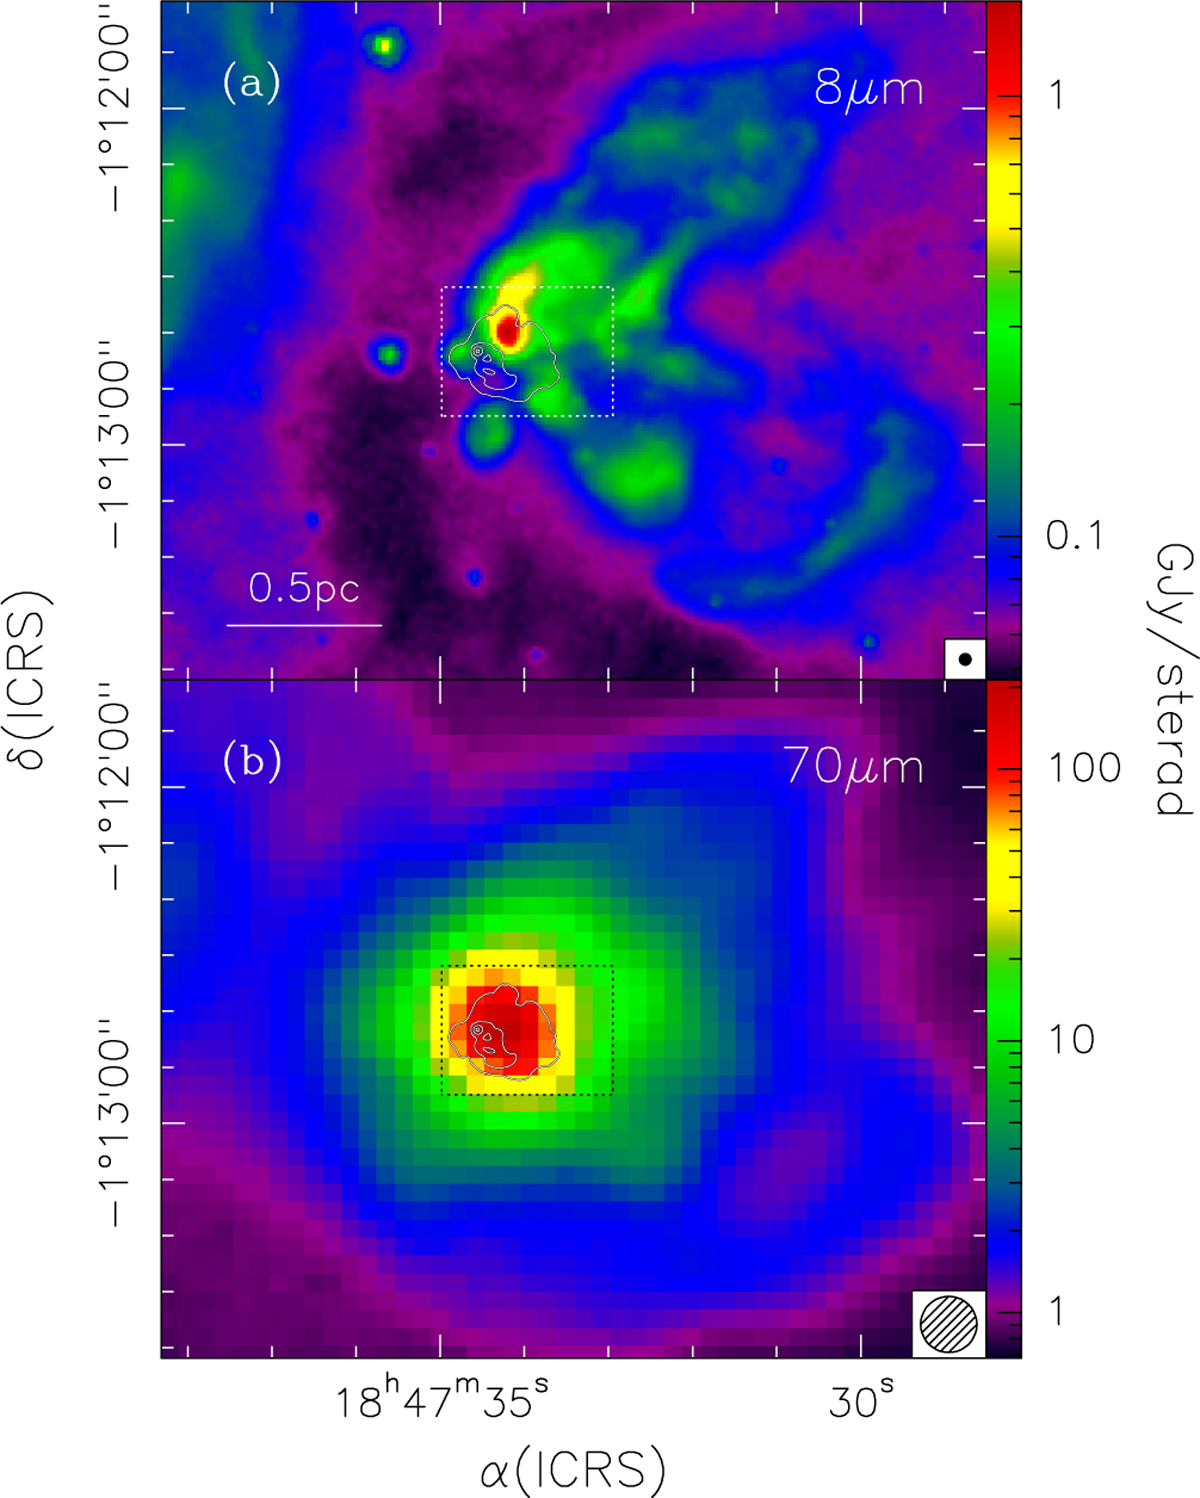
(a) Overlay of the 1 cm map of Fig. 1 (contours) and the 8 μm image from the Spitzer/GLIMPSE database (colour image). Contour levels range from 1 to 28 in steps of 9 mJy/beam. The angular resolution of the latter image is shown in the bottom-right corner. The dotted rectangle outlines the region shown in Figs. 1a and c. (b) Same as panel a, for the 70 μm image obtained from the Herschel/Hi-GAL survey.
Current usage metrics show cumulative count of Article Views (full-text article views including HTML views, PDF and ePub downloads, according to the available data) and Abstracts Views on Vision4Press platform.
Data correspond to usage on the plateform after 2015. The current usage metrics is available 48-96 hours after online publication and is updated daily on week days.
Initial download of the metrics may take a while.