Fig. 20
Download original image
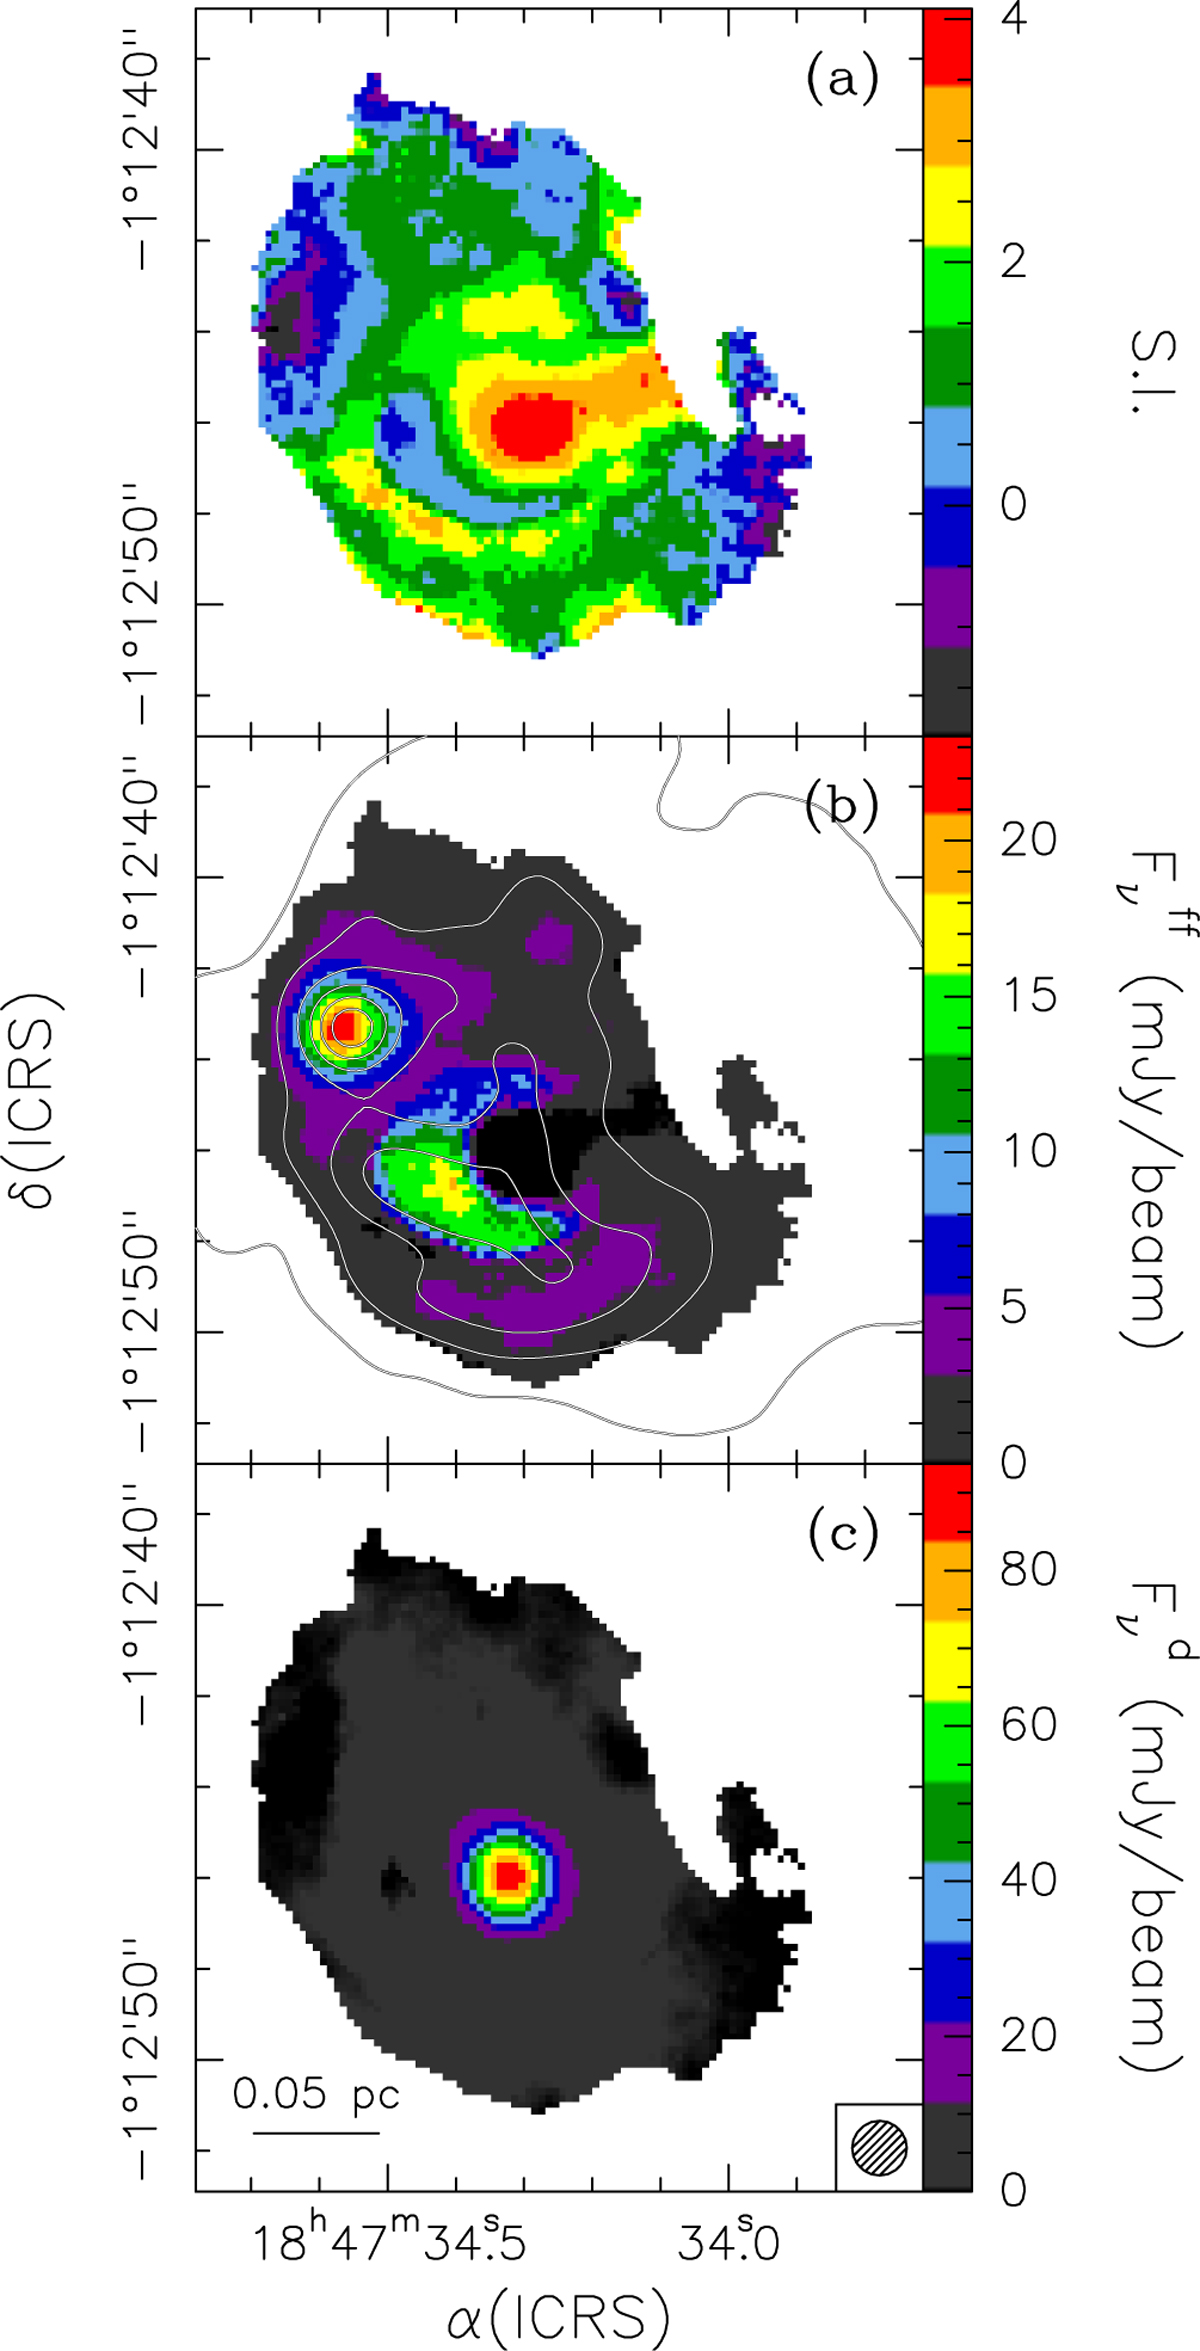
(a) Map (colour image) of the spectral index of the 3 mm continuum emission computed from the emission at the minimum and maximum frequencies observed in the GUAPOS survey. (b) Contour map of the 1 cm continuum emission overlaid on the map of the 3 mm free-free continuum emission calculated using the spectral index information (see text). Contour levels range from 1 to 26 in steps of 5 mJy/beam. (c) Same as panel b, for the 3 mm dust continuum emission. The synthesised beam is shown in the bottom-right corner.
Current usage metrics show cumulative count of Article Views (full-text article views including HTML views, PDF and ePub downloads, according to the available data) and Abstracts Views on Vision4Press platform.
Data correspond to usage on the plateform after 2015. The current usage metrics is available 48-96 hours after online publication and is updated daily on week days.
Initial download of the metrics may take a while.