Fig. 24
Download original image
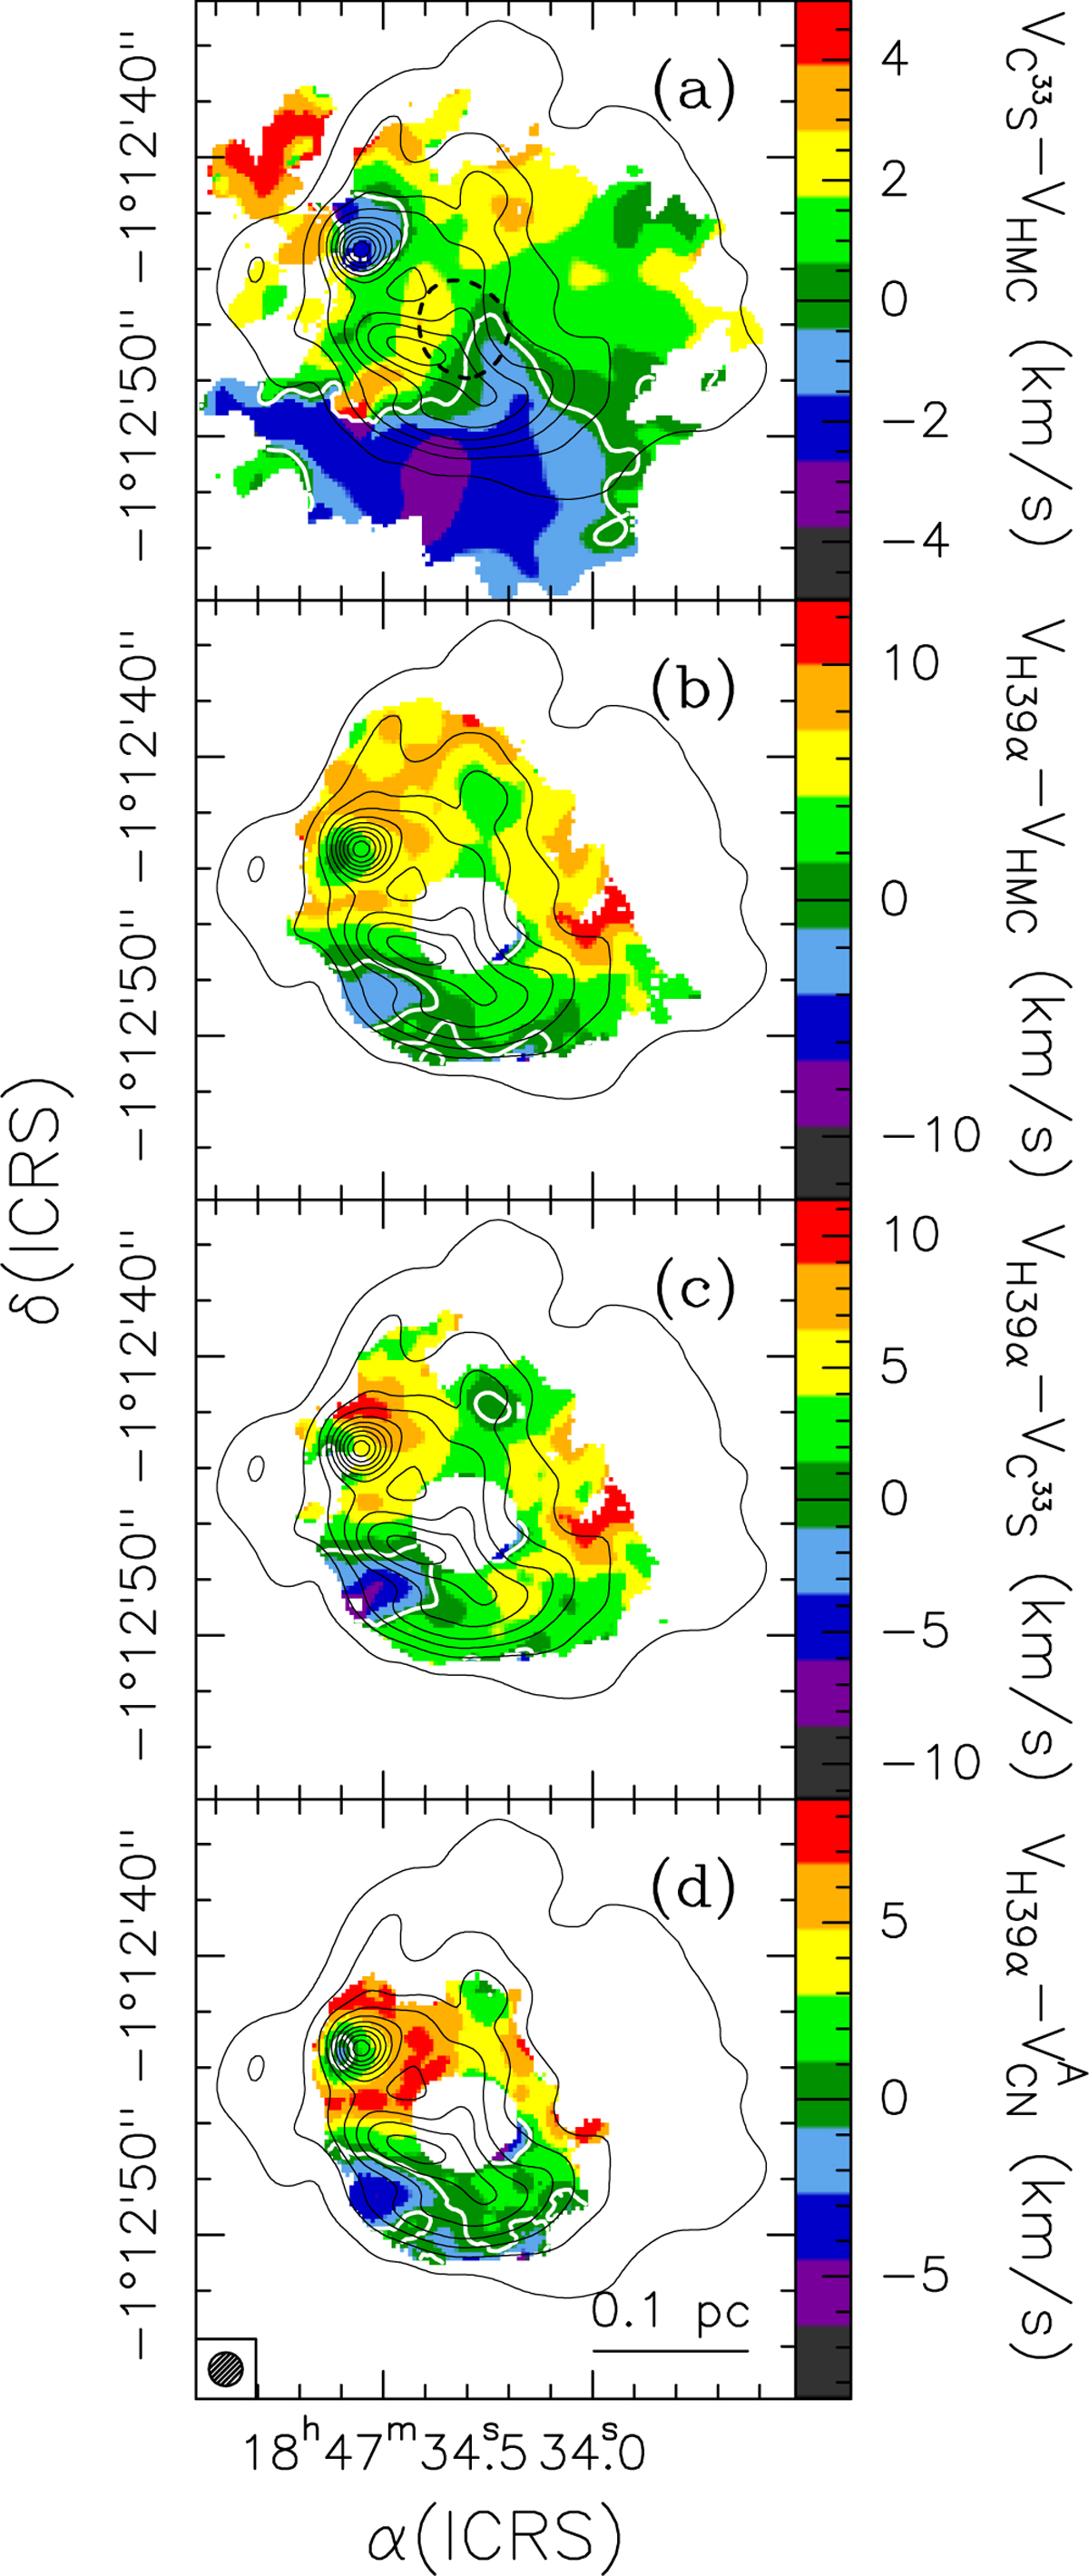
(a) Map of the difference between the velocity of the C33 S(2-1) line and the systemic LSR velocity of the HMC (96.5 km s−1 ). The white contours correspond to 0 km s−1. The black contours are the same as in Fig. 6. The dotted pattern outlines the approximate border of the HMC. (b) Same as panel a, for the difference between the velocity of the H39α line and that of the HMC. (c) Same as panel a, for the difference between the velocity of the H39α line and that of the C33 S(2-1) line. (d) Same as panel a, for the difference between the velocity of the H39α line and that of the absorption dip of the CN(1-0) line. the HMC. The synthesised beam is shown in the bottom-right corner.
Current usage metrics show cumulative count of Article Views (full-text article views including HTML views, PDF and ePub downloads, according to the available data) and Abstracts Views on Vision4Press platform.
Data correspond to usage on the plateform after 2015. The current usage metrics is available 48-96 hours after online publication and is updated daily on week days.
Initial download of the metrics may take a while.