Fig. 25
Download original image
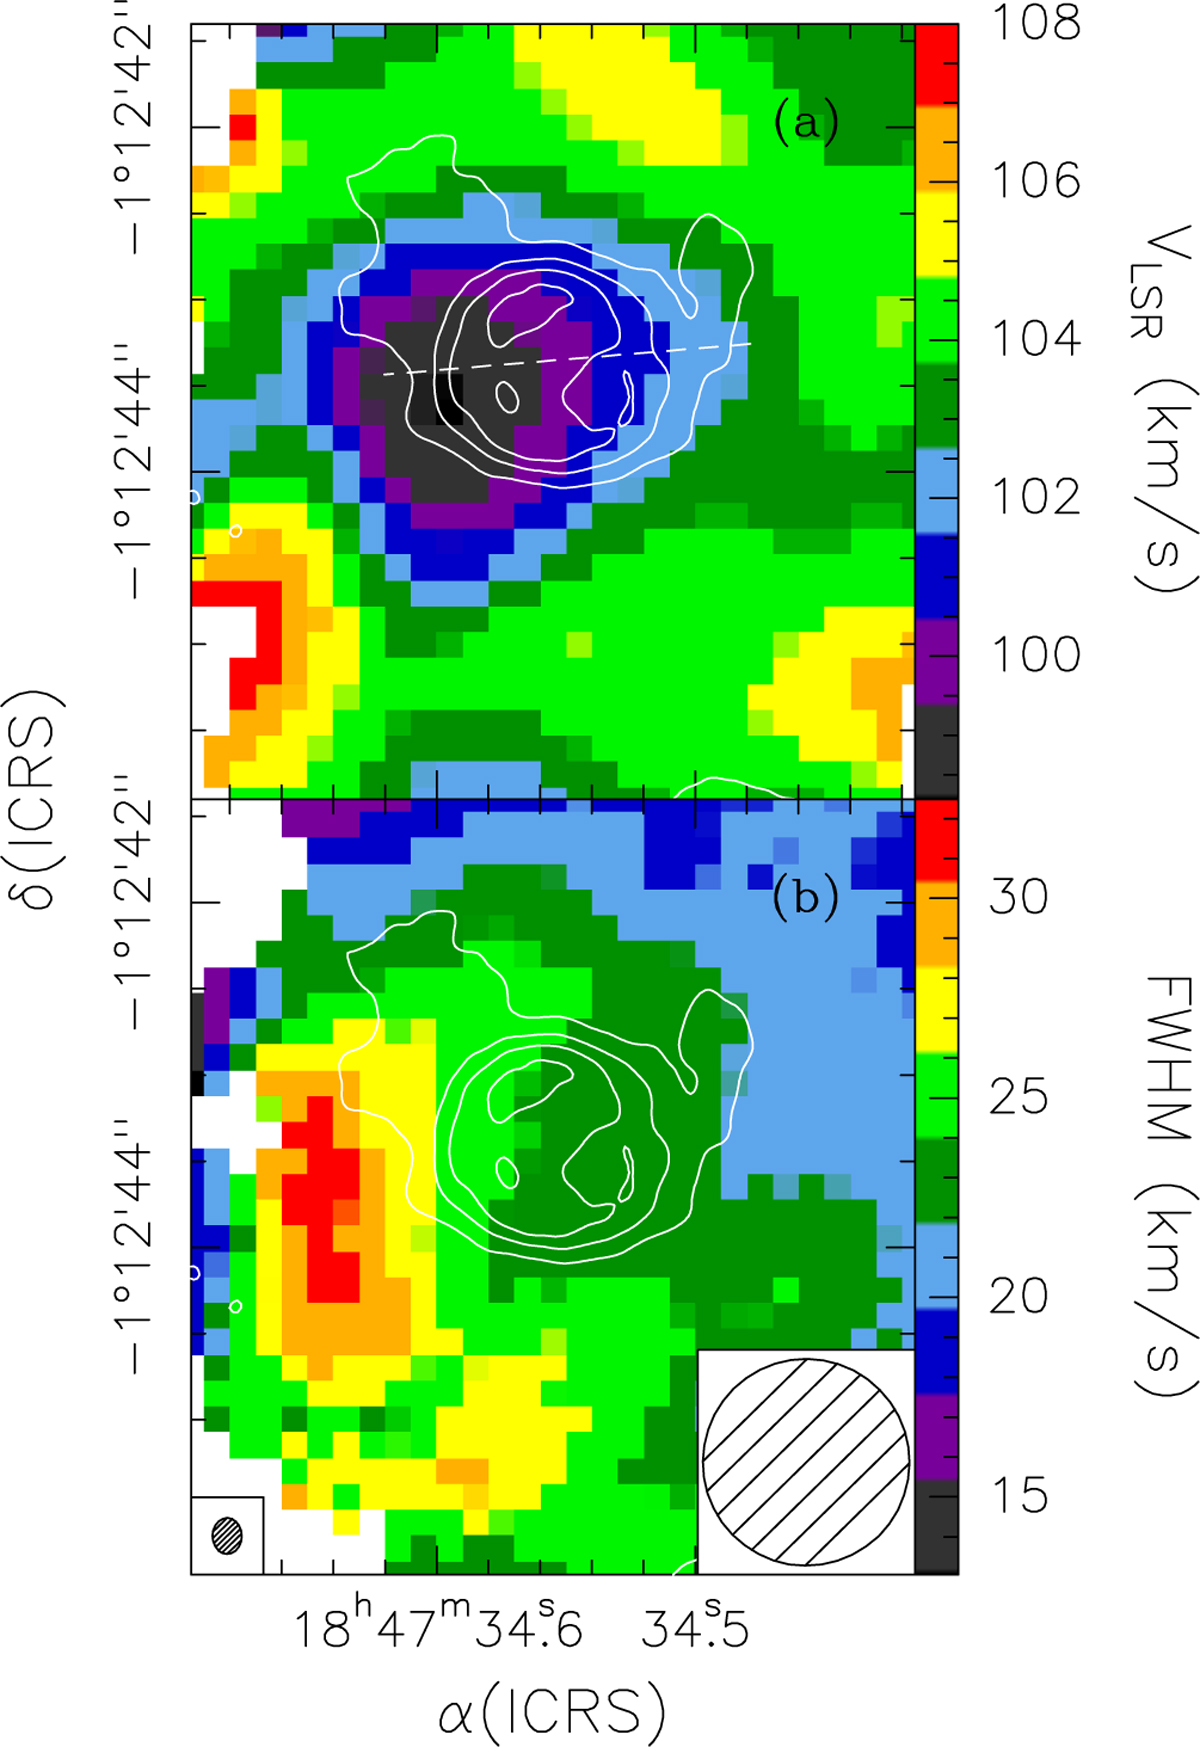
(a) Contour map of the 7 mm continuum emission (enlargement of the map in Fig. 1) overlaid on the H40α velocity map (colour image) of Fig. 4. The dashed line marks the approximate axis of the cometary shaped UC HII region as well as the approximate direction of the velocity gradient across it. (b) Same as panel a, for the line FWHM. The synthesised beams are shown in the bottom left (for the 7 mm map) and right (for the velocity map) corners.
Current usage metrics show cumulative count of Article Views (full-text article views including HTML views, PDF and ePub downloads, according to the available data) and Abstracts Views on Vision4Press platform.
Data correspond to usage on the plateform after 2015. The current usage metrics is available 48-96 hours after online publication and is updated daily on week days.
Initial download of the metrics may take a while.