Fig. 3
Download original image
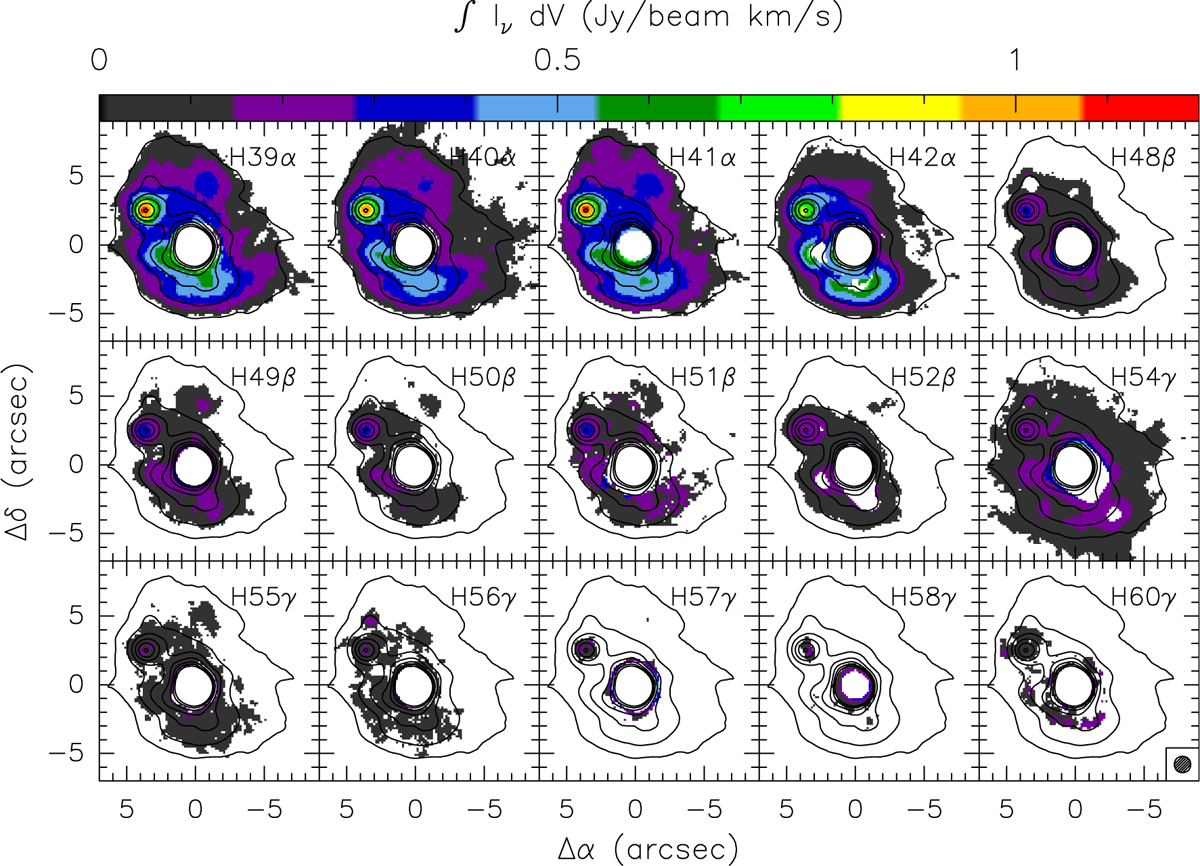
Maps of the integrated emission over the hydrogen recombination lines indicated in the top right corner of each panel. The emission from the HMC is not plotted because the recombination lines are heavily blended with stronger molecular transitions. The circle in the bottomright corner is the synthesised beam. The offsets are relative to the phase centre of the ALMA observations. The emission of the H54γ line is contaminated by two hyperfine components of the NS J = 5/2 → 3/2 transition.
Current usage metrics show cumulative count of Article Views (full-text article views including HTML views, PDF and ePub downloads, according to the available data) and Abstracts Views on Vision4Press platform.
Data correspond to usage on the plateform after 2015. The current usage metrics is available 48-96 hours after online publication and is updated daily on week days.
Initial download of the metrics may take a while.