Open Access
Fig. 6
Download original image
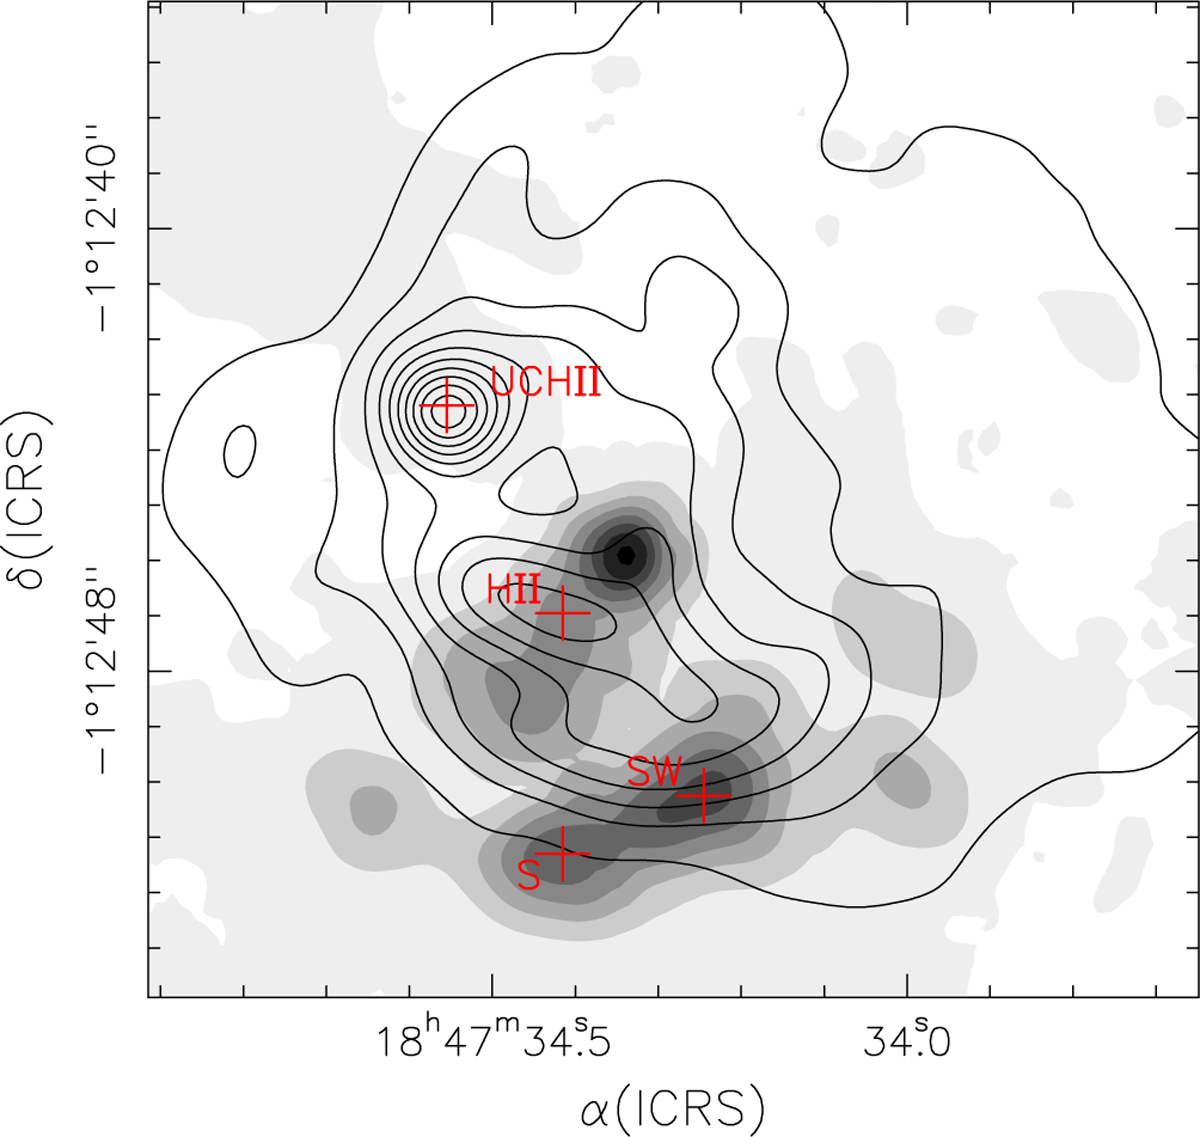
Contour map of the 1 cm continuum emission overlaid on a map of the peak emission in the H13CO+(1-0) line (grey scale). Contour levels range from 1 to 28 in steps of 3 mJy/beam. The crosses and corresponding labels denote the four template positions that the spectra of Figs. 7–10 have been taken towards.
Current usage metrics show cumulative count of Article Views (full-text article views including HTML views, PDF and ePub downloads, according to the available data) and Abstracts Views on Vision4Press platform.
Data correspond to usage on the plateform after 2015. The current usage metrics is available 48-96 hours after online publication and is updated daily on week days.
Initial download of the metrics may take a while.