Fig. 7
Download original image
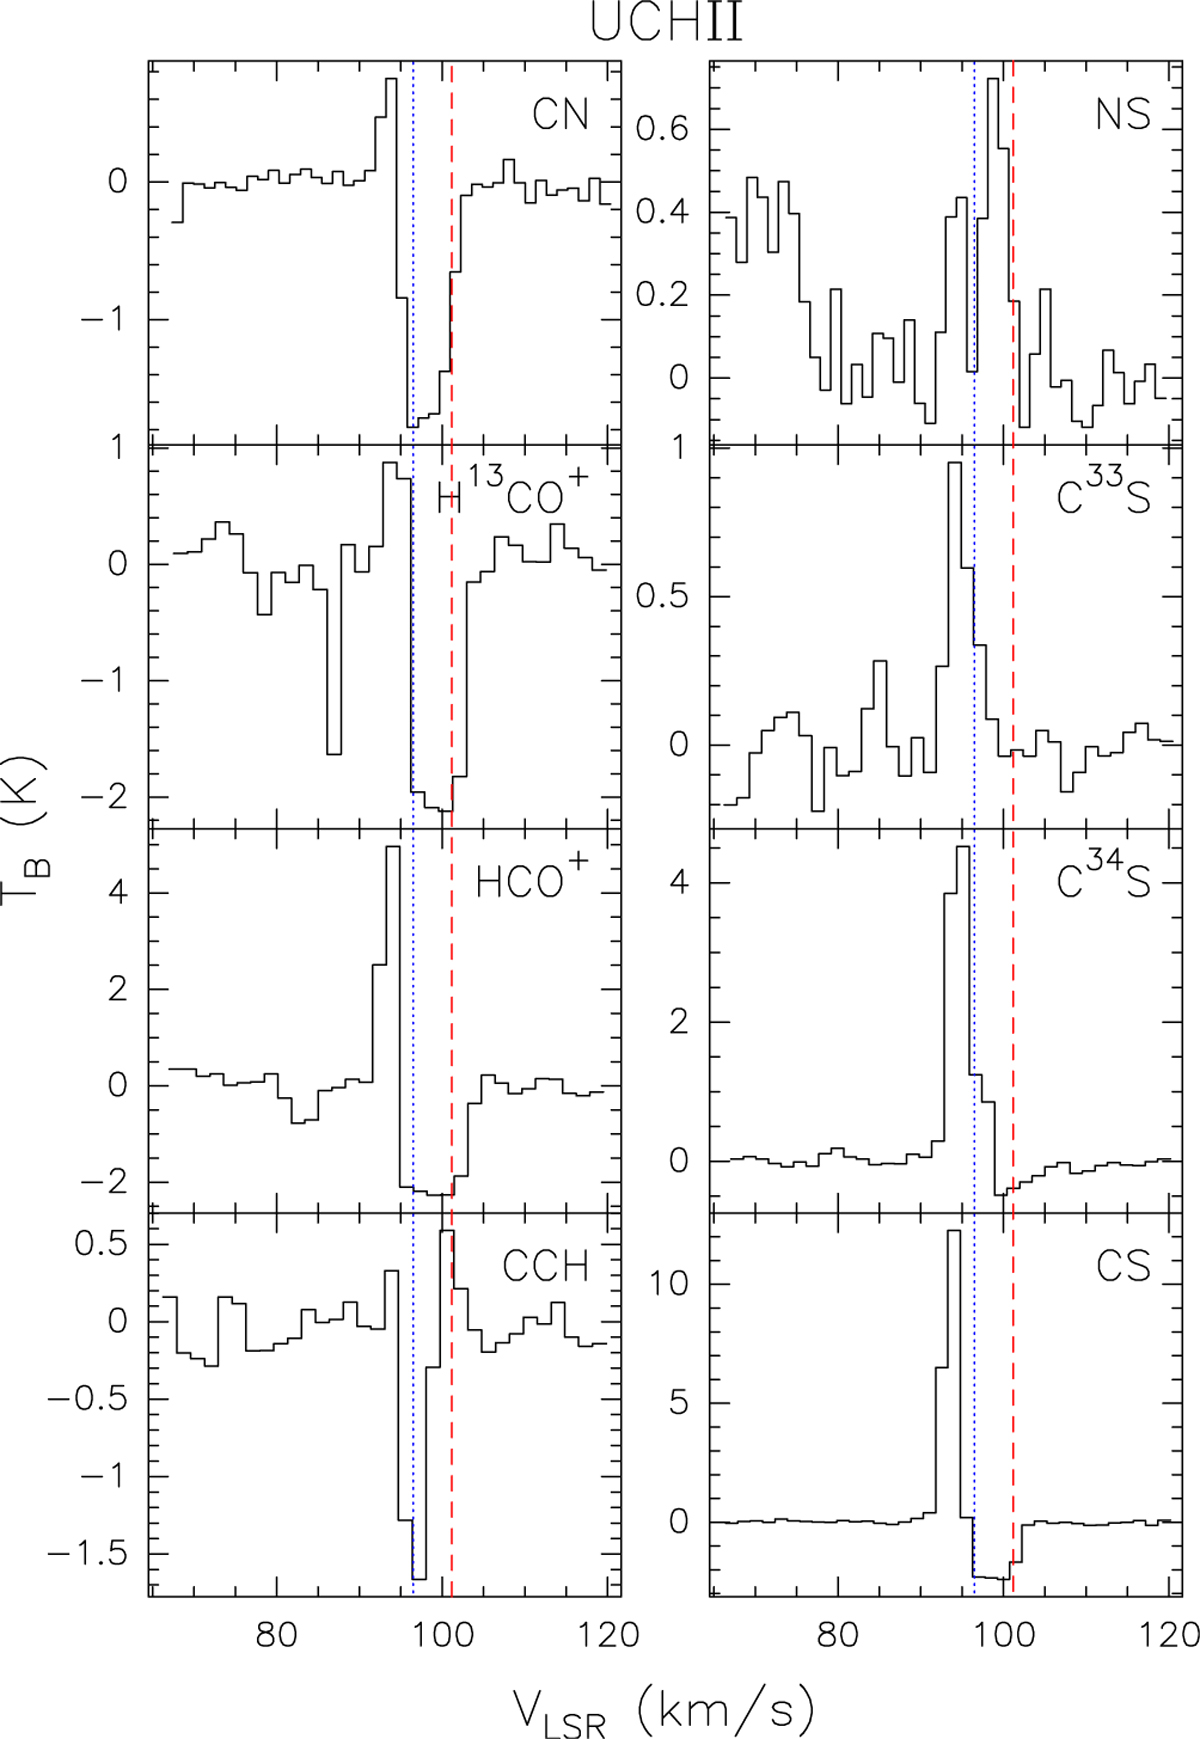
Spectra of various molecular lines (as indicated in each panel) observed towards the UCHII position in Fig. 6 with ICRS coordinates 18h47m34s.555-01° 12′43″.20. The blue dotted and red dashed lines mark, respectively, the systemic LSR velocity of the HMC (96.5 km s−1; Cesaroni et al. 2011) and the peak velocity of the H39α recombination line measured at the given position.
Current usage metrics show cumulative count of Article Views (full-text article views including HTML views, PDF and ePub downloads, according to the available data) and Abstracts Views on Vision4Press platform.
Data correspond to usage on the plateform after 2015. The current usage metrics is available 48-96 hours after online publication and is updated daily on week days.
Initial download of the metrics may take a while.