Fig. 1
Download original image
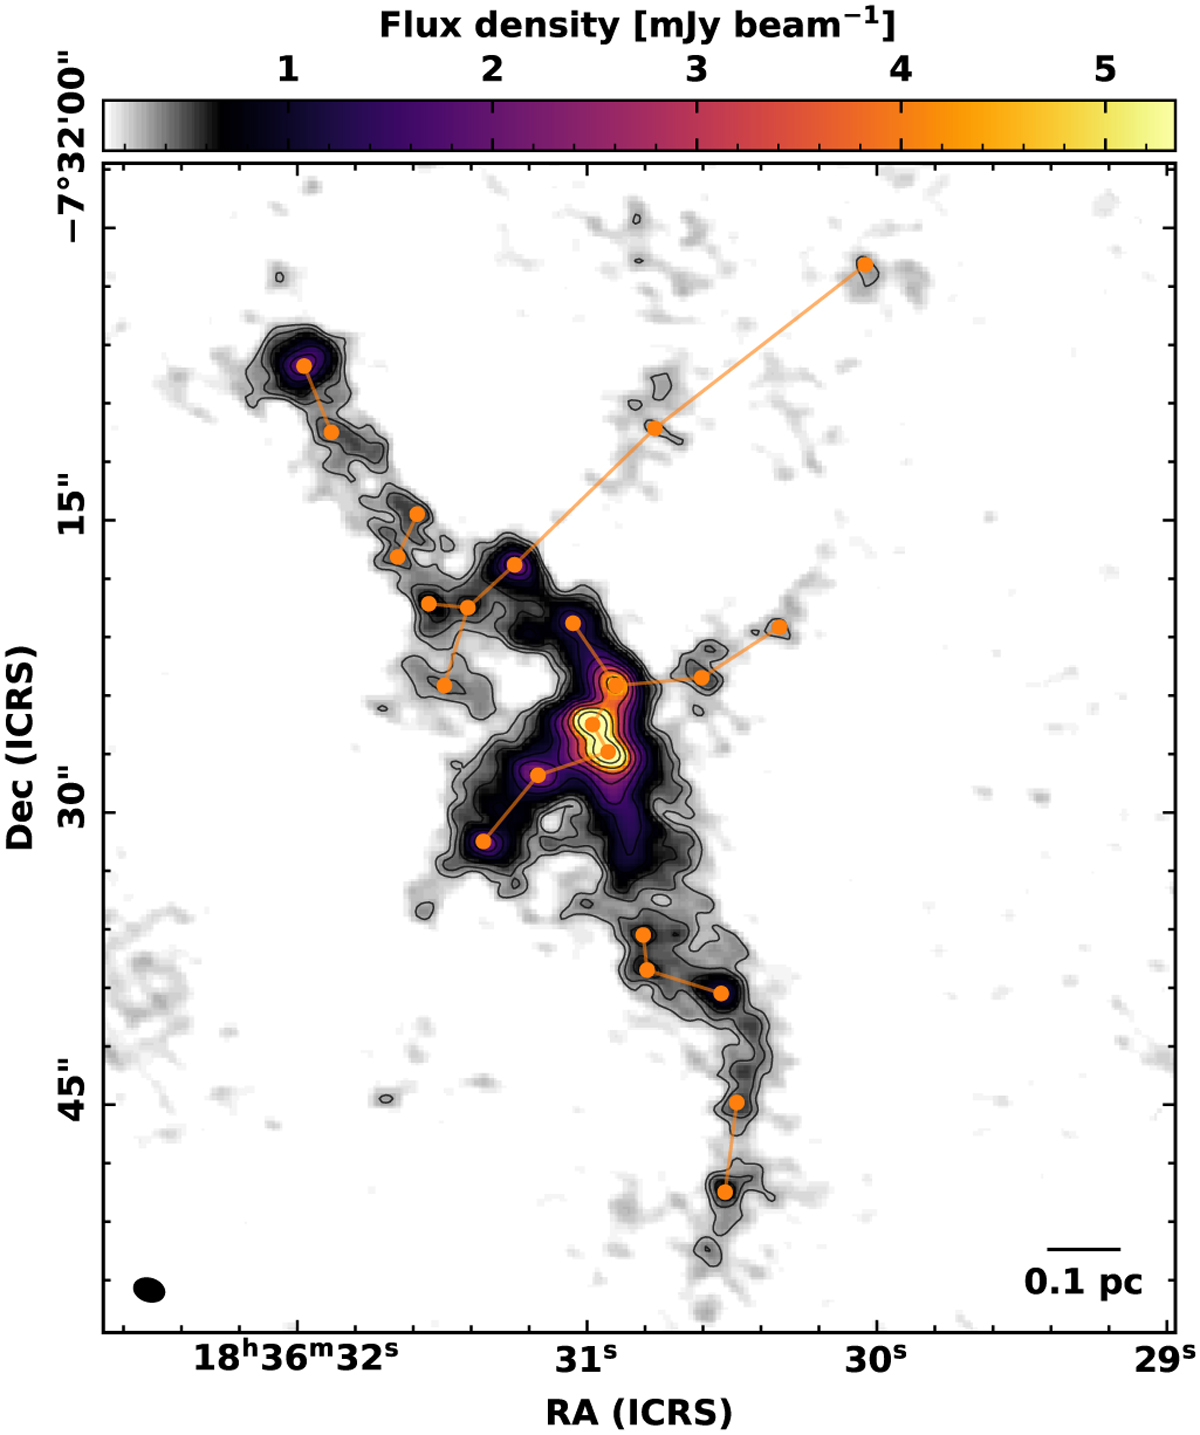
Example of a 1.3 mm continuum image from the ASHES survey (Morii et al. 2023), overlaid with the NN graph (orange lines). The background colour scale and contours show the ALMA 12 m plus 7 m continuum emission, with contour levels at 3 × 2nσ (n = 0, 1, 2, . . .), where σ = 9.5 × 10⁻⁵ Jy beam−1 is the rms noise level. Detected core positions are marked by orange circles, and the scale bar in the lower left corresponds to 0.1 pc at the assumed distance 5.5 kpc.
Current usage metrics show cumulative count of Article Views (full-text article views including HTML views, PDF and ePub downloads, according to the available data) and Abstracts Views on Vision4Press platform.
Data correspond to usage on the plateform after 2015. The current usage metrics is available 48-96 hours after online publication and is updated daily on week days.
Initial download of the metrics may take a while.