Fig. A.1
Download original image
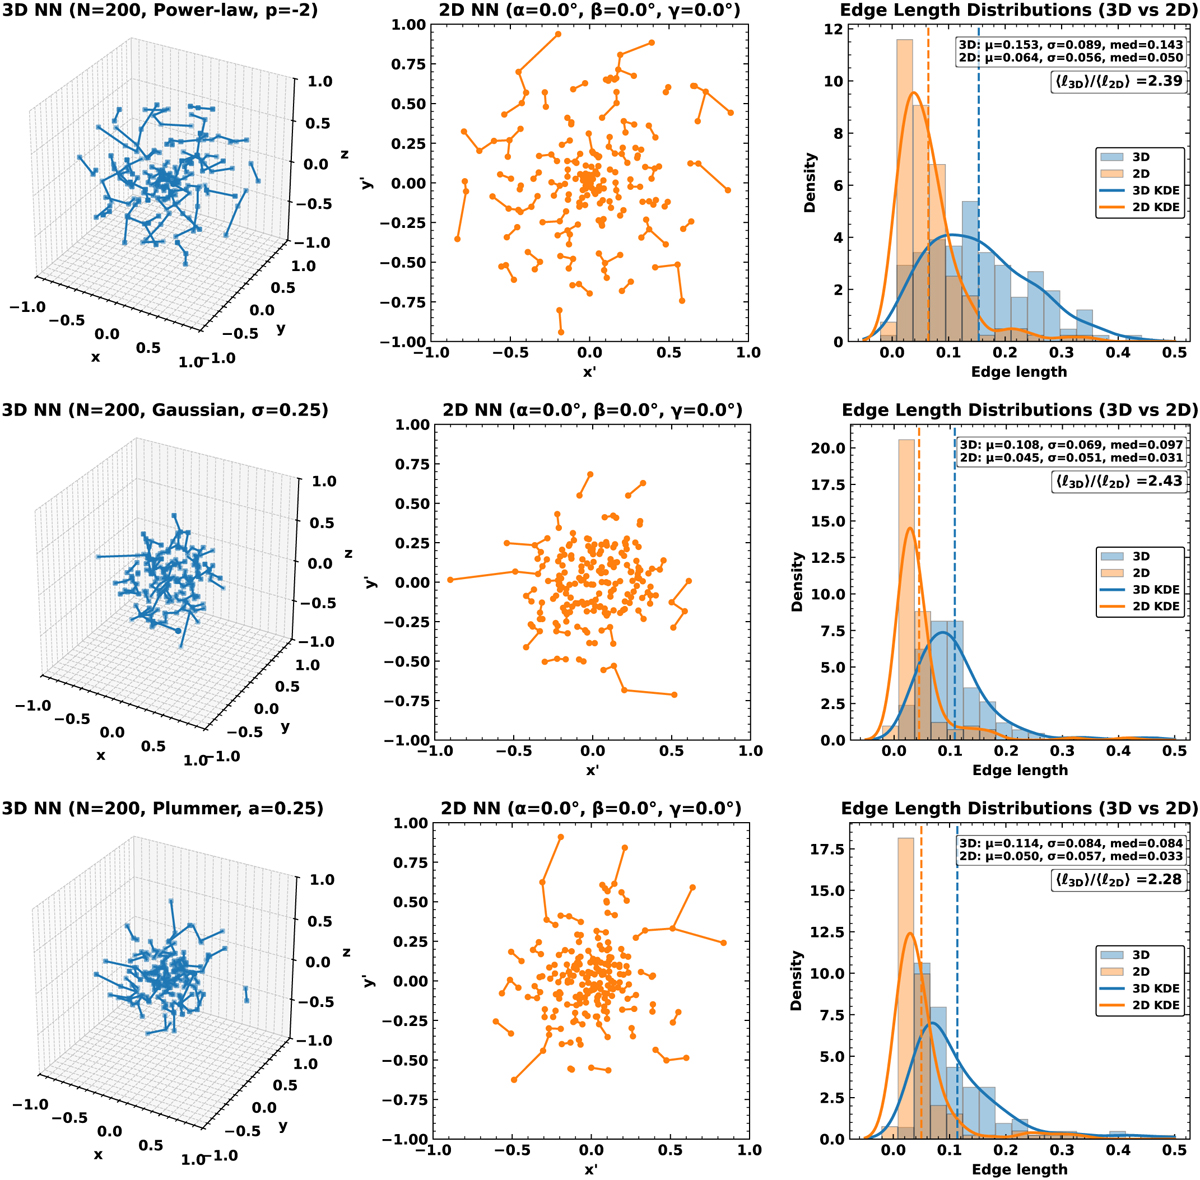
Nearest-neighbour comparisons for N = 200 points drawn from three centrally concentrated spherical profiles within R = 1.0. Top: Power law with slope p = −2. Middle: truncated Gaussian with σ = 0.25. Bottom: Plummer with scale radius a = 0.25. Each row shows the 3D NN graph (left), the 2D projection (centre), and the corresponding distributions of NN edge lengths (right). Projection shortens apparent separations and rewires most nodes to new, closer neighbours in 2D, with mean ratios ℓ3D/ℓ2D ~ 2.3–2.4, well above the geometric baseline 4/π ≃ 1.27.
Current usage metrics show cumulative count of Article Views (full-text article views including HTML views, PDF and ePub downloads, according to the available data) and Abstracts Views on Vision4Press platform.
Data correspond to usage on the plateform after 2015. The current usage metrics is available 48-96 hours after online publication and is updated daily on week days.
Initial download of the metrics may take a while.