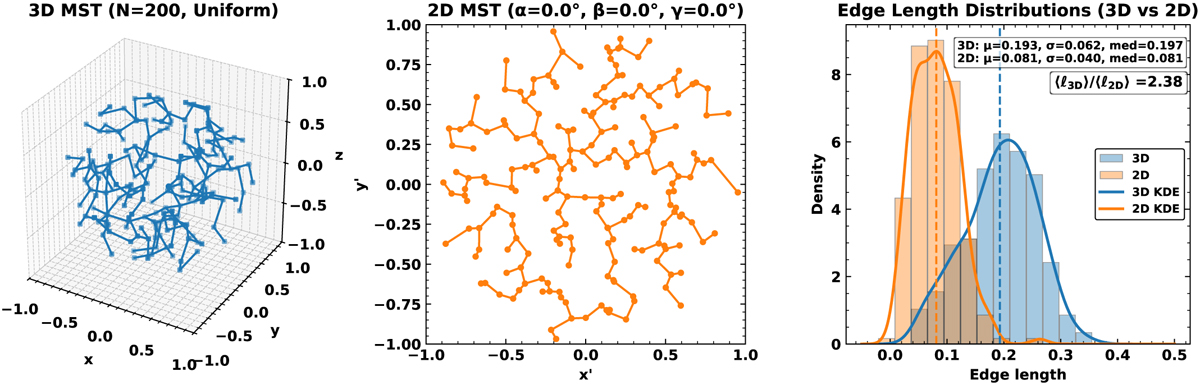
Fig. B.1
Download original image
Minimum spanning tree comparison for a uniform spherical distribution of N=200 points within radius R=1.0. Left: MST network constructed in 3D. Centre: MST built from the projected 2D positions (no rotation). Right: Distributions of MST edge lengths in 3D (blue) and 2D (orange), with medians (dashed lines) and kernel density estimates (KDEs) overplotted. The total MST length decreases from 38.4 (3D) to 16.1 (2D), corresponding to a mean ratio ⟨ℓ3D/ℓ2D⟩ ≃ 2.38, well above the geometric expectation (4/π) ≃ 1.27. Only ~25% of 3D edges are recovered in 2D (Jaccard similarity 0.14), indicating that projection not only foreshortens MST edges but also rewires the network topology—though less severely than for the NN graph (cf. Fig. 2).
Current usage metrics show cumulative count of Article Views (full-text article views including HTML views, PDF and ePub downloads, according to the available data) and Abstracts Views on Vision4Press platform.
Data correspond to usage on the plateform after 2015. The current usage metrics is available 48-96 hours after online publication and is updated daily on week days.
Initial download of the metrics may take a while.