Fig. 2
Download original image
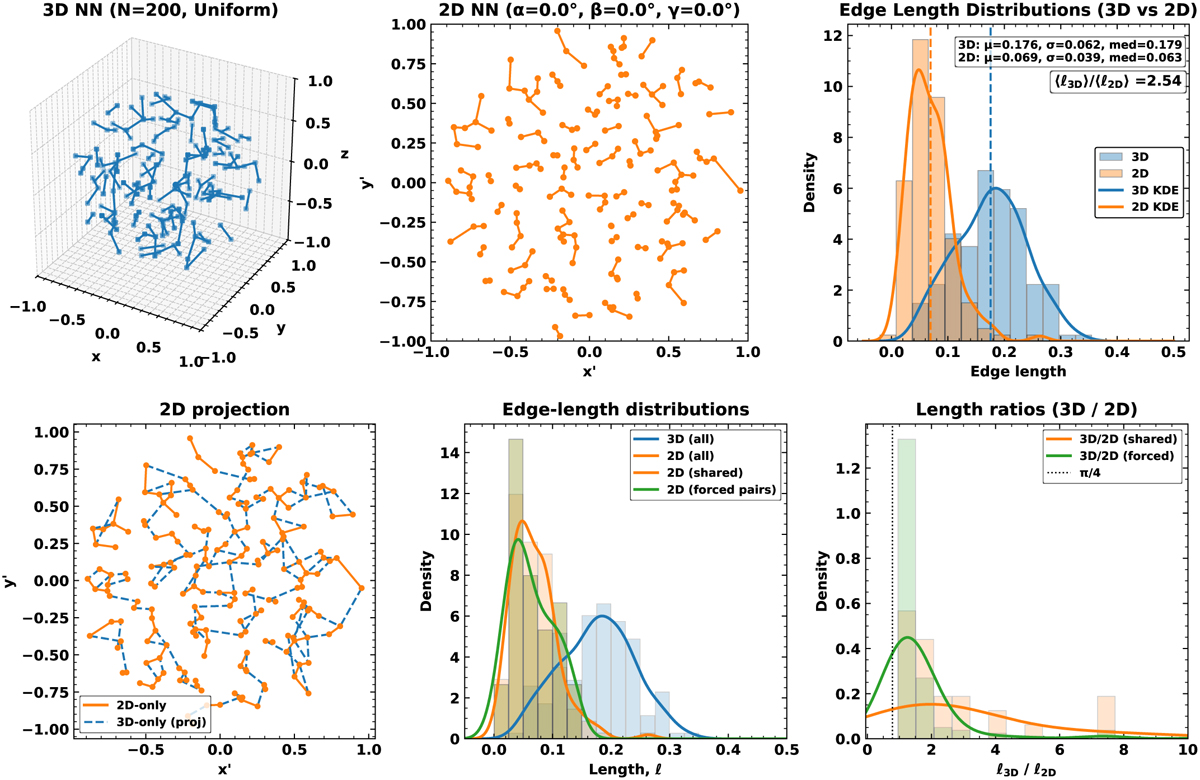
Nearest-neighbour comparisons for N = 200 points drawn from a uniform spherical distribution within R = 1.0. Top: NN graph constructed in 3D, where the blue connections are the 3D NNs (left); 2D projection, where the orange connections are the 2D NNs (Centre); and the corresponding distributions of NN edge lengths (right) highlighting the overall shortening in projection. Bottom: detailed breakdown. The left panel repeats the 2D overlay of 3D and 2D edges, while the right panels show the distributions of ℓ3D, ℓ2D for shared edges and the ratios ℓ3D/ℓ2D. Vertical dashed lines mark the medians, and KDEs are overplotted on the histograms. Together these panels illustrate how projection both compresses lengths and reassigns neighbours, with only the very shortest pairs surviving unchanged.
Current usage metrics show cumulative count of Article Views (full-text article views including HTML views, PDF and ePub downloads, according to the available data) and Abstracts Views on Vision4Press platform.
Data correspond to usage on the plateform after 2015. The current usage metrics is available 48-96 hours after online publication and is updated daily on week days.
Initial download of the metrics may take a while.