Fig. 3
Download original image
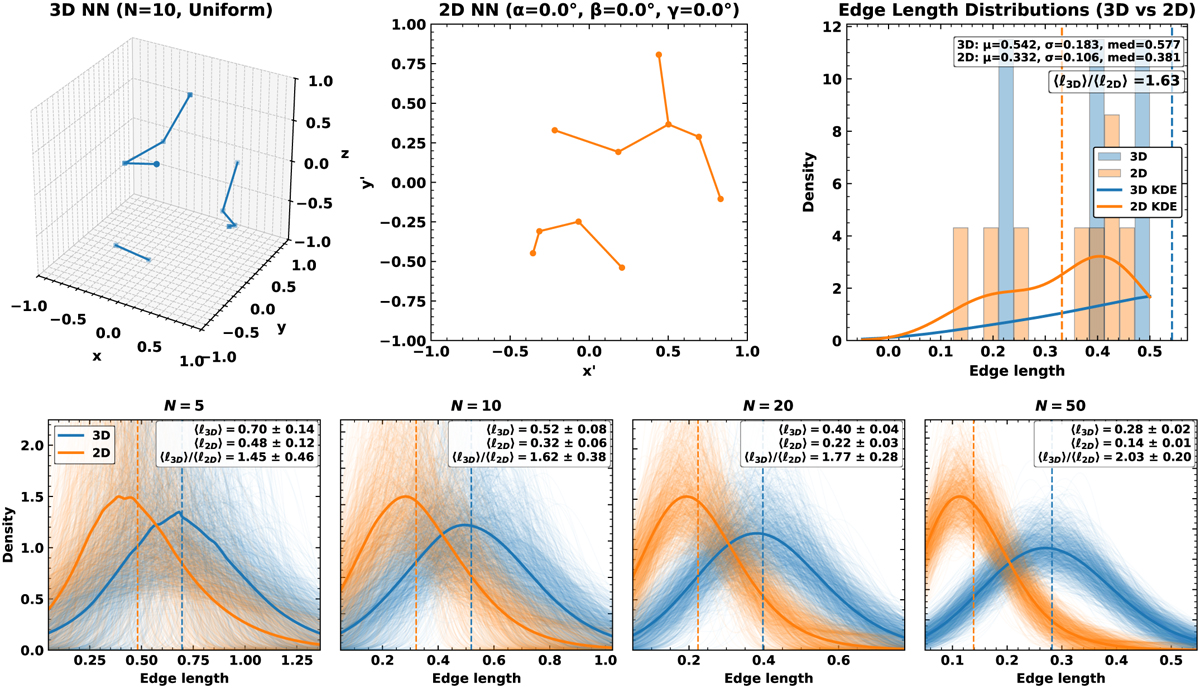
Nearest-neighbour comparisons for uniformly sampled point distributions. Top: example realisation with N = 10 points drawn within a sphere of radius of R = 1.0. The NN graph constructed in 3D (left), its 2D projection obtained by dropping the line-of-sight coordinate (centre), and the corresponding edge-length distributions (right) illustrate how projection systematically shortens apparent separations and modifies the network connectivity even in a simple isotropic configuration. Bottom: results from the Monte Carlo ensembles (103 realisations each) for N = 5, 10, 20, and 50 showing stacked kernel density estimates of 3D (blue) and projected 2D (orange) NN edge lengths. The distributions converge at a stable median ratio as N increases, while stochastic fluctuations dominate at small values of N.
Current usage metrics show cumulative count of Article Views (full-text article views including HTML views, PDF and ePub downloads, according to the available data) and Abstracts Views on Vision4Press platform.
Data correspond to usage on the plateform after 2015. The current usage metrics is available 48-96 hours after online publication and is updated daily on week days.
Initial download of the metrics may take a while.