Fig. 4
Download original image
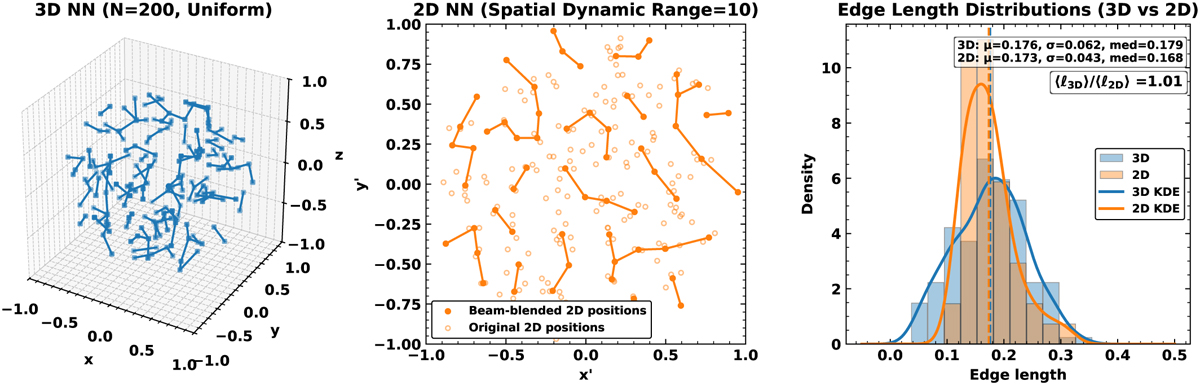
Illustration of the impact of a finite SDR on NN statistics using a uniform distribution of N = 200 points within a sphere of radius R = 1.0. Left: intrinsic 3D NN graph. Centre: two-dimensional projection after applying a beam–blending step that merges points closer than one beam width, corresponding here to a SDR of SDR = FoV/FWHMbeam = 10. Circles mark the original 2D positions (open) and the resulting beam-blended centroids (filled). Right: distributions of NN edge lengths in 3D and 2D after blending. In this example, 135 of the 200 projected cores (67.5%) are merged into 65 effective groups, erasing all topological correspondence between the intrinsic and projected networks (J = 0.00, overlap fraction = 0). The typical 3D and 2D NN lengths become nearly equal (⟨ℓ3D⟩/⟨ℓ2D⟩ ≃ 1.0), as beam blending suppresses the shortest intrinsic separations that normally produce the geometric compression factor (4/π ≃ 1.27). This example illustrates that limited spatial resolution can strongly distort the apparent connectivity and scale distribution of dense cores even in an intrinsically uniform configuration.
Current usage metrics show cumulative count of Article Views (full-text article views including HTML views, PDF and ePub downloads, according to the available data) and Abstracts Views on Vision4Press platform.
Data correspond to usage on the plateform after 2015. The current usage metrics is available 48-96 hours after online publication and is updated daily on week days.
Initial download of the metrics may take a while.