Fig. 5
Download original image
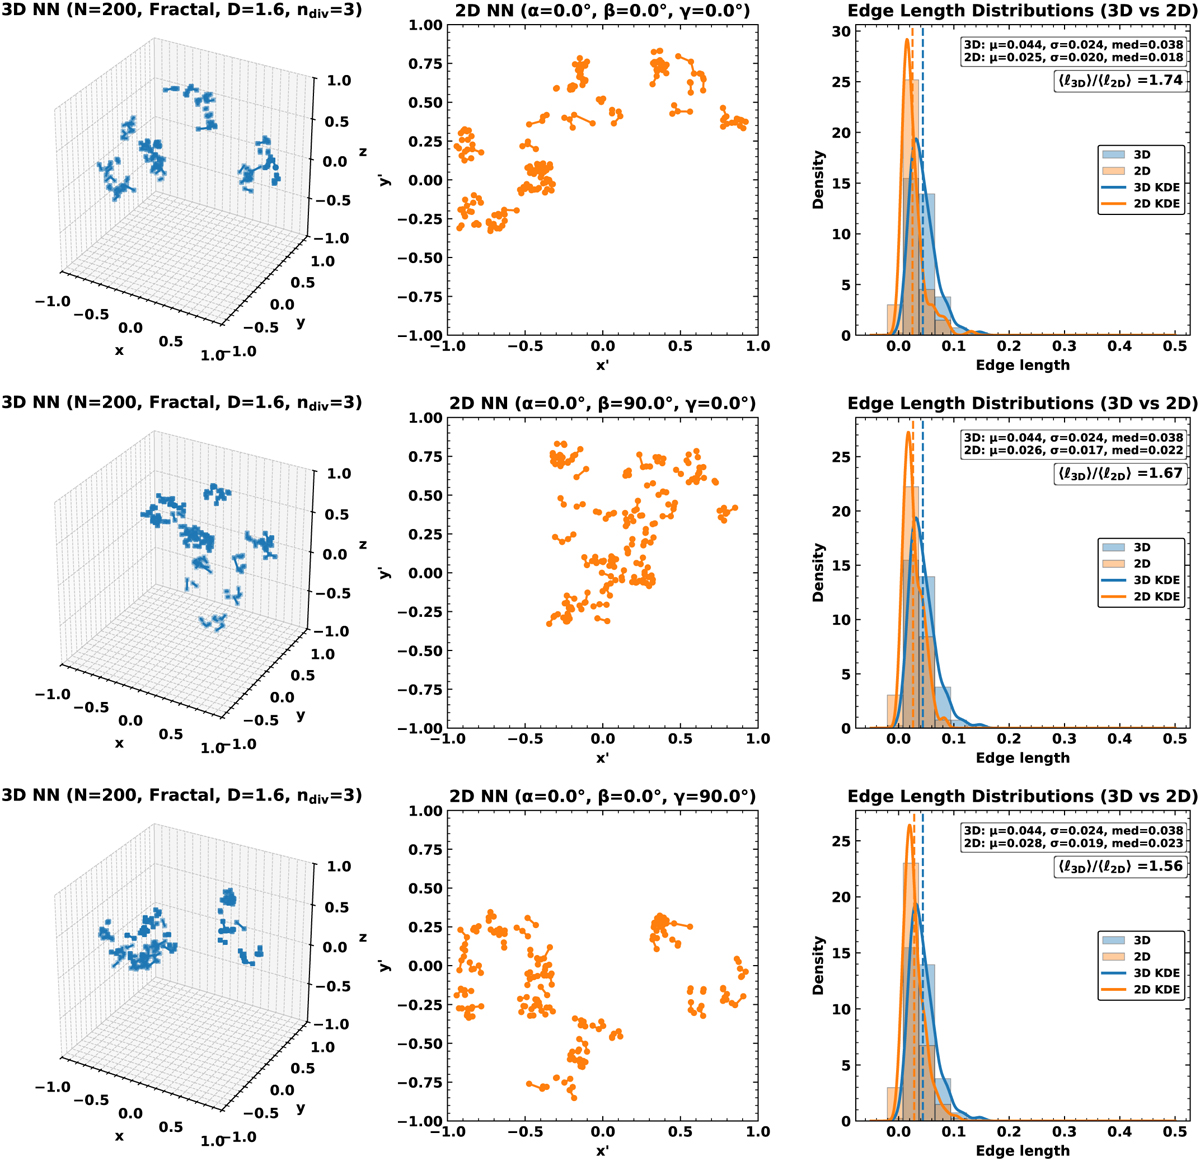
Nearest-neighbour graphs for a fractal distribution with N = 200 points, fractal dimension D = 1.6, and sub-division ndiv = 3, within R = 1.0. Each row shows the NN network in 3D (left), the projected NN network in 2D (centre), and the corresponding NN edge-length distributions (right). The three rows illustrate different viewing geometries: no rotation (top), rotation about the y-axis (β = 90°; middle), and rotation about the z-axis (γ = 90°; bottom). Projection systematically shortens the apparent NN separations and rewires connectivity, but the degree of overlap and compression depends on the line of sight, reflecting the anisotropic and clumpy structure of the fractal distribution.
Current usage metrics show cumulative count of Article Views (full-text article views including HTML views, PDF and ePub downloads, according to the available data) and Abstracts Views on Vision4Press platform.
Data correspond to usage on the plateform after 2015. The current usage metrics is available 48-96 hours after online publication and is updated daily on week days.
Initial download of the metrics may take a while.