Fig. 6
Download original image
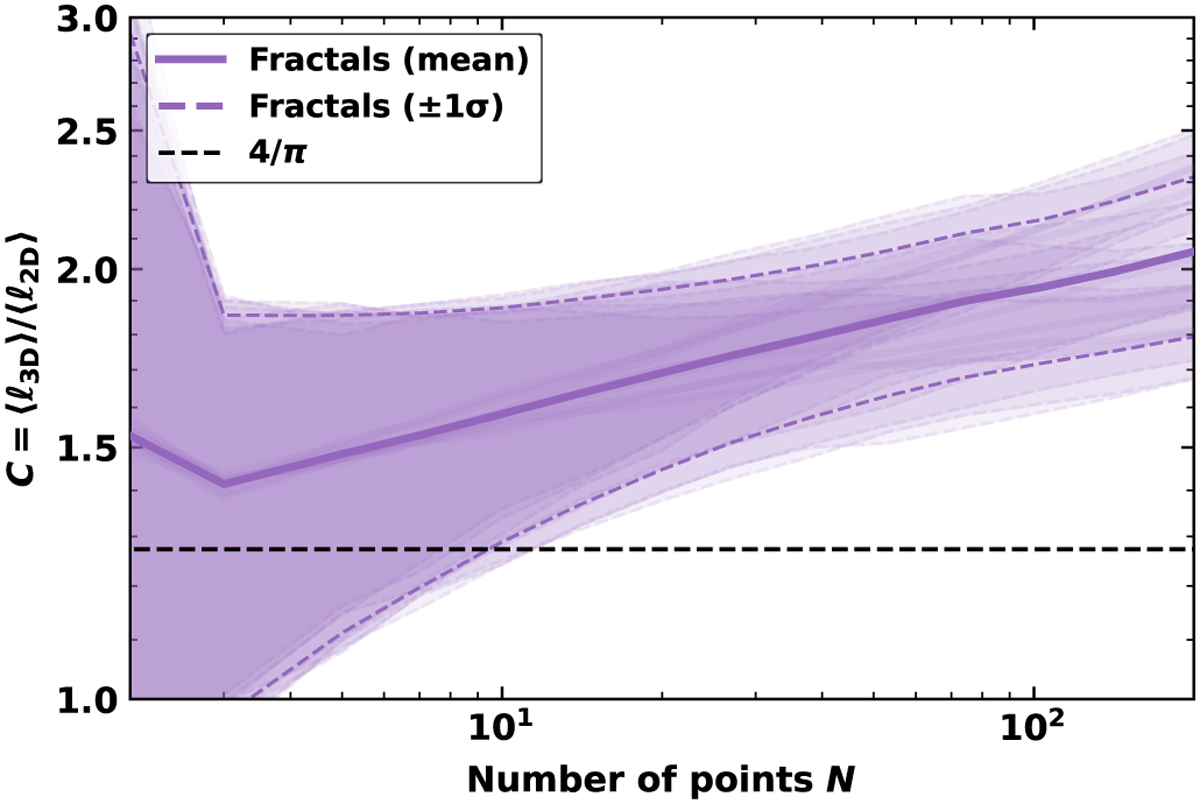
Nearest-neighbour projection ratio ℓ3D/ℓ2D versus sample size N for fractal ensembles. For each N, we averaged 100 realisations per configuration and then combined across nine fractal setups (D ∈ {1.7, 2.0, 2.5}, ndiv ∈ {2, 3, 4}) with jitter=True and prune=True. The solid curve shows the cross-configuration mean, and the dashed curves indicate ±1σ across configurations (not the run-to-run uncertainty). The dashed horizontal line marks the geometric fixed-pair baseline 4/π ≃ 1.27. Projection bias is present at all N, with ℓ3D/ℓ2D increasing sub-linearly with N and reaching ~2.0–2.3 by N = 200, depending on fractal parameters. A higher D (less clumpy) yields larger ratios at a fixed N, indicating that beyond geometric compression, crowding and neighbour reassignment drive additional shortening in projection.
Current usage metrics show cumulative count of Article Views (full-text article views including HTML views, PDF and ePub downloads, according to the available data) and Abstracts Views on Vision4Press platform.
Data correspond to usage on the plateform after 2015. The current usage metrics is available 48-96 hours after online publication and is updated daily on week days.
Initial download of the metrics may take a while.