Fig. 9
Download original image
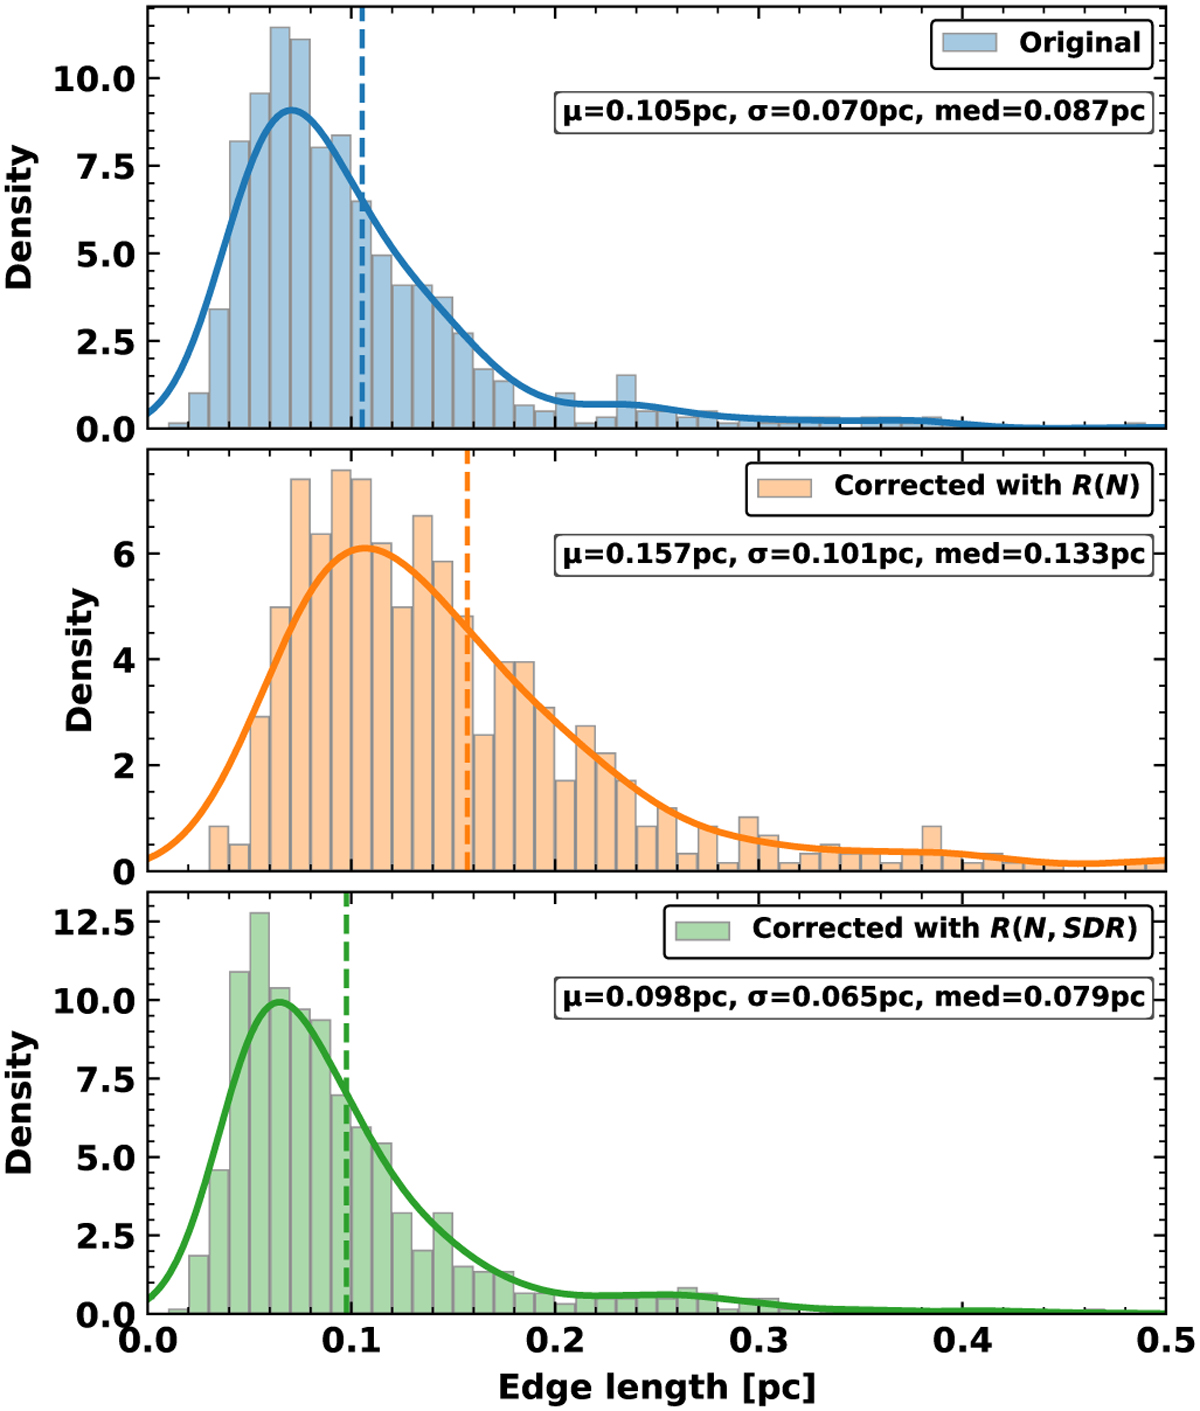
Effect of projection and resolution corrections on the distribution of NN separations in the ASHES survey (Morii et al. 2024). Top: Observed (projected) 2D separations. Middle: Separations corrected for projection bias using the Sample-size-dependent relation 𝒞(N) (Eq. (7)). Bottom: Separations corrected for both projection and finite angular resolution using 𝒞(N, SDR) (Eq. (6)). Dashed lines mark the median values in each panel. The uncorrected distribution peaks near 0.08 pc, increases to 0.12 pc after applying 𝒞(N), but returns to 0.07 pc when the finite dynamic range (SDR ~ 10–20, defined as clump radius to beam FWHM) is included. This demonstrates the competing influences of geometric projection, which lengthens apparent separations, and beam blending, which suppresses the shortest scales (note the caveats of applying this correction to observations in Sect. 5.3).
Current usage metrics show cumulative count of Article Views (full-text article views including HTML views, PDF and ePub downloads, according to the available data) and Abstracts Views on Vision4Press platform.
Data correspond to usage on the plateform after 2015. The current usage metrics is available 48-96 hours after online publication and is updated daily on week days.
Initial download of the metrics may take a while.