Fig. B.1
Download original image
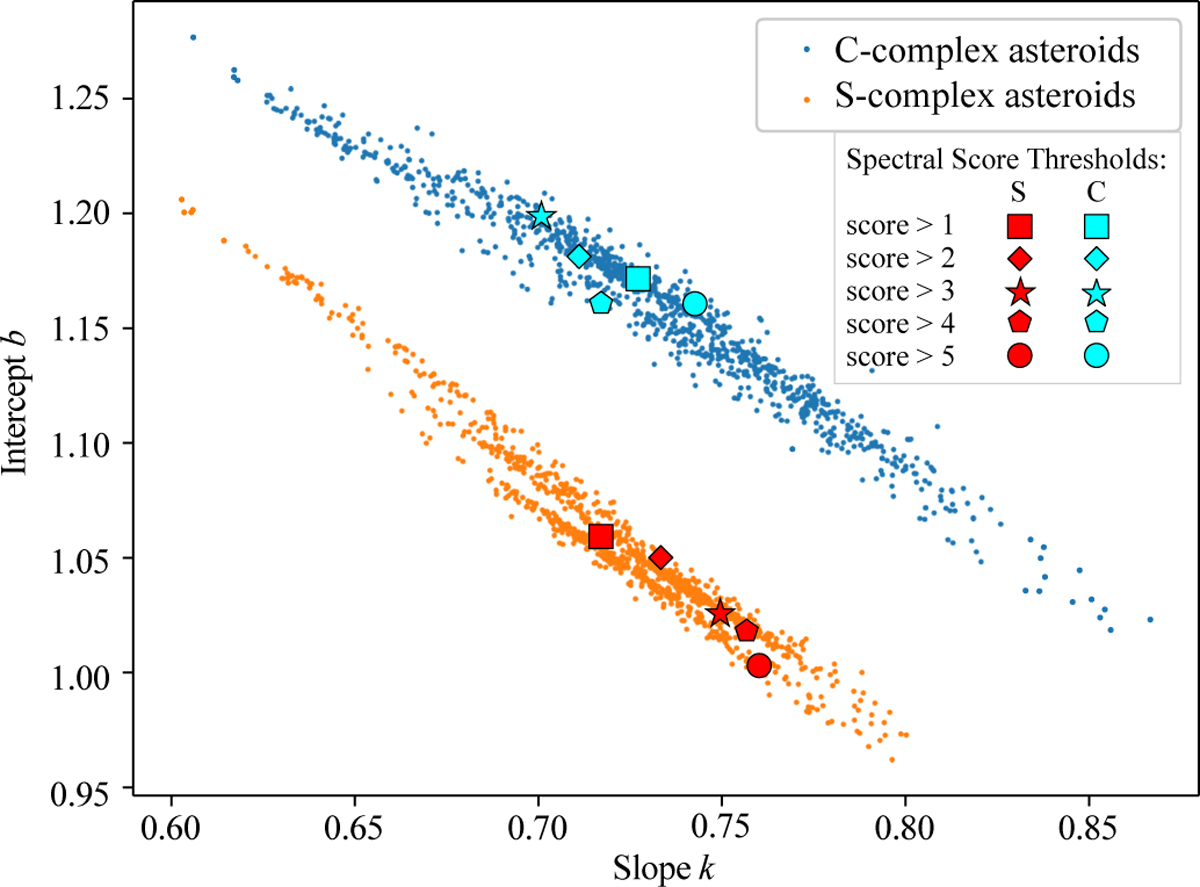
Same as Fig. 5, showing the distributions of the valley parameters k and b (Eq. 1) for S-complex and C-complex asteroids. Over-plotted points indicate the best-fit valley solutions obtained from the dataset using progressively stricter spectral-classification score thresholds between 1 and 5 (as indicated by different symbols). Because the symbols lie within the distributions from the nominal datasets (see text), this illustrates the robustness of the fitted parameters versus changes in the spectral score threshold to the adopted spectral-quality cut.
Current usage metrics show cumulative count of Article Views (full-text article views including HTML views, PDF and ePub downloads, according to the available data) and Abstracts Views on Vision4Press platform.
Data correspond to usage on the plateform after 2015. The current usage metrics is available 48-96 hours after online publication and is updated daily on week days.
Initial download of the metrics may take a while.