Fig. 1.
Download original image
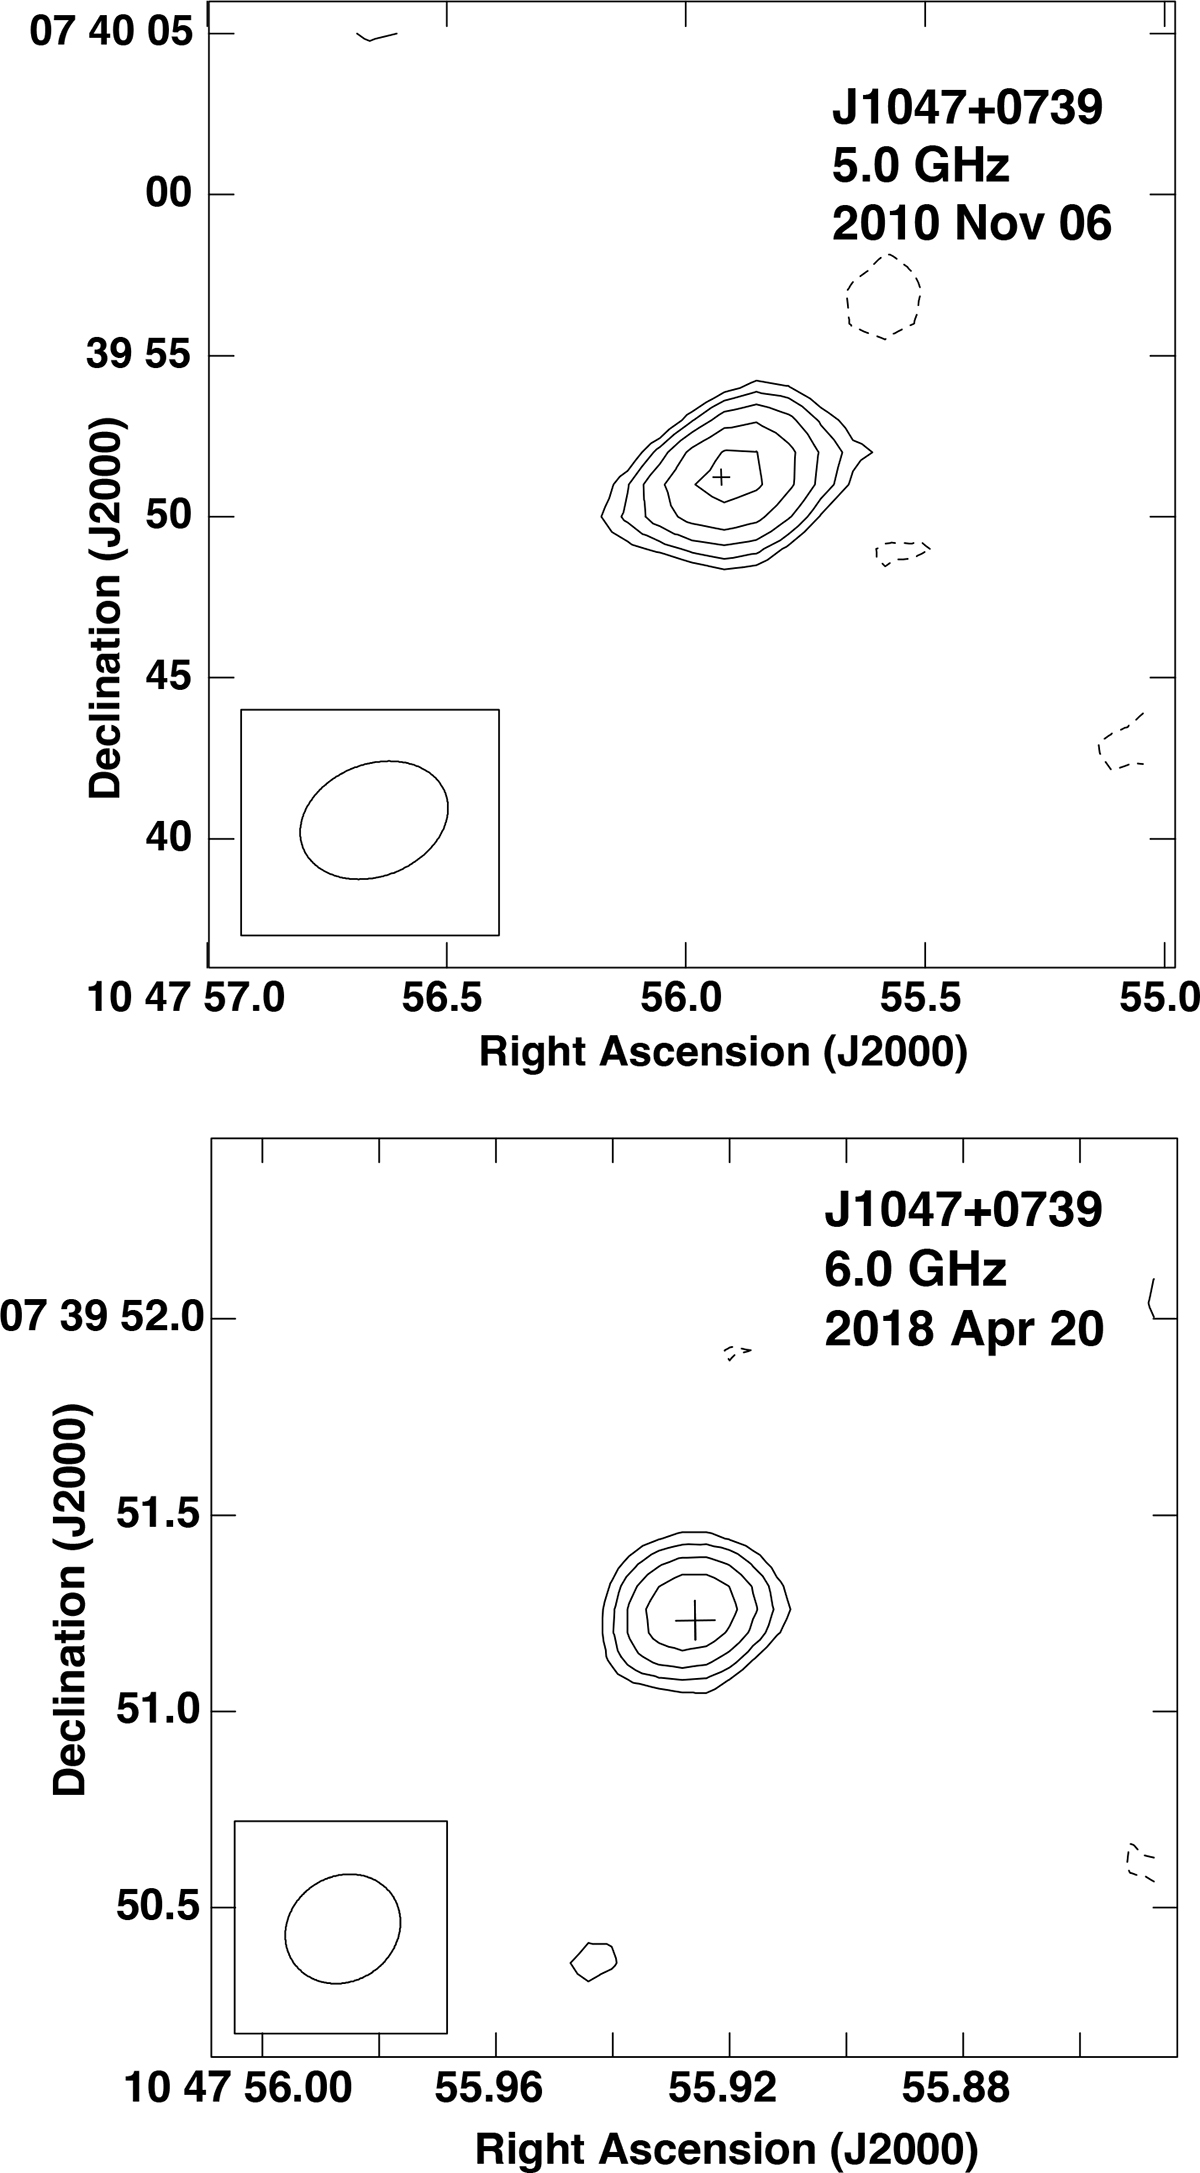
Top: VLA contour image of the J1047+0739 region from project 10B-156. The contours start at ±3σ and increase by factors of ![]() , where σ = 9.0 μJy beam−1, the rms in this region of the image. The synthesized beam (
, where σ = 9.0 μJy beam−1, the rms in this region of the image. The synthesized beam (![]() ; −69°) is shown in the bottom left corner. Bottom: VLA contour image of the J1047+0739 region from project 18A-413. The contours start at ±3σ and increase by factors of
; −69°) is shown in the bottom left corner. Bottom: VLA contour image of the J1047+0739 region from project 18A-413. The contours start at ±3σ and increase by factors of ![]() , where σ = 8.0 μJy beam−1, the rms in this region of the image. The synthesized beam (
, where σ = 8.0 μJy beam−1, the rms in this region of the image. The synthesized beam (![]() ; −56°) is shown in the bottom left corner. In both images, the cross marks the optical position of the source from Gaia Early Data Release 3 (Gaia Collaboration 2020).
; −56°) is shown in the bottom left corner. In both images, the cross marks the optical position of the source from Gaia Early Data Release 3 (Gaia Collaboration 2020).
Current usage metrics show cumulative count of Article Views (full-text article views including HTML views, PDF and ePub downloads, according to the available data) and Abstracts Views on Vision4Press platform.
Data correspond to usage on the plateform after 2015. The current usage metrics is available 48-96 hours after online publication and is updated daily on week days.
Initial download of the metrics may take a while.