Fig. C.2
Download original image
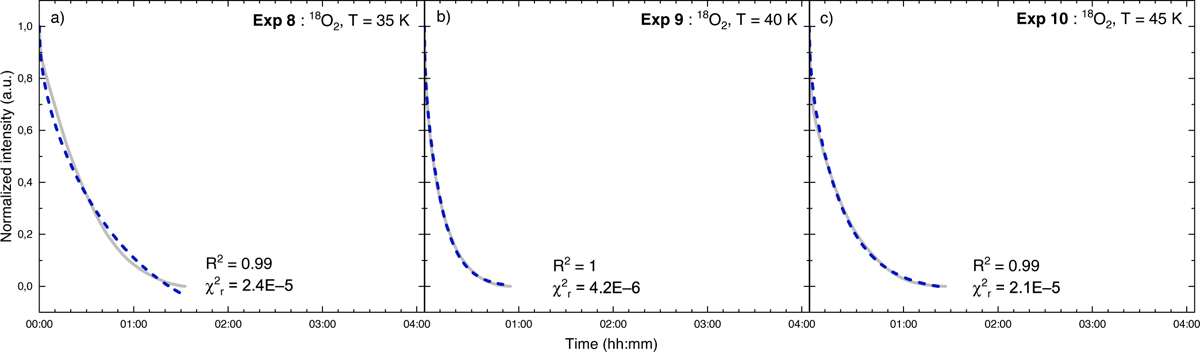
Results of the fits to the Fickian model (blue) for all experimental data (gray) recorded during the four hour isothermal phase: (a)–(c) correspond to the fits of experiments 8 to 10 conducted at 35 K, 40 K and 45 K respectively, with a 40 ML water-ice matrix. Data is truncated once diffusion ceases, i.e., when the plateau is reached.
Current usage metrics show cumulative count of Article Views (full-text article views including HTML views, PDF and ePub downloads, according to the available data) and Abstracts Views on Vision4Press platform.
Data correspond to usage on the plateform after 2015. The current usage metrics is available 48-96 hours after online publication and is updated daily on week days.
Initial download of the metrics may take a while.