| Issue |
A&A
Volume 707, March 2026
|
|
|---|---|---|
| Article Number | A168 | |
| Number of page(s) | 12 | |
| Section | Interstellar and circumstellar matter | |
| DOI | https://doi.org/10.1051/0004-6361/202558327 | |
| Published online | 11 March 2026 | |
Experimental investigation of O2 diffusion and entrapment in interstellar amorphous solid water
1
Département de Chimie, Université Paris-Saclay,
Gif-sur-Yvette
91190,
France
2
Laboratory for Astrophysics, Leiden Observatory, Leiden University,
PO Box 9513,
2300
RA
Leiden,
The Netherlands
3
Center for Astrophysics, Harvard & Smithsonian,
60 Garden St.,
Cambridge,
MA
02138,
USA
★ Corresponding author: This email address is being protected from spambots. You need JavaScript enabled to view it.
Received:
1
December
2025
Accepted:
10
January
2026
Abstract
Context. Interstellar ices are mainly composed of amorphous solid water (ASW) containing small amounts of hypervolatiles, such as O2, whose diffusion-limited reactions play a key role in space chemistry. Although O2 is an important precursor molecule present during the early stages of ice formation, its surface diffusion in ASW remains poorly constrained.
Aims. In this study, we experimentally investigate the surface diffusion and the entrapment efficiency of O2 in porous ASW under astrophysically relevant conditions.
Methods. Experiments were conducted in an ultrahigh vacuum chamber and monitored using infrared (IR) spectroscopy and quadrupole mass spectrometry. Diffusion coefficients were extracted through a novel approach applicable to IR-inactive molecules, by fitting the mass spectrometer signal during the isothermal phase with a Fickian model. These coefficients were then used to derive the diffusion energy barrier of O2 in ASW. Entrapment efficiencies were measured by analyzing the subsequent temperature-programmed desorption phase.
Results. We measured the surface diffusion coefficients at different temperatures (35 K, 40 K, 45 K) and water ice coverages (40 ML, 60 ML, 80 ML), yielding values on the order of 10−16–10−15 cm2 s−1. From these values, we derived a diffusion energy barrier of Ediff = 10 ± 3 meV (116 ± 35 K), corresponding to a χ ratio of about 0.1. Entrapment measurements revealed that a residual amount of ~20% of O2 remains trapped in the ASW matrix at the highest temperatures investigated.
Conclusions. This work demonstrates that the surface diffusion of IR-inactive molecules can be experimentally quantified using mass spectrometry. Our findings show that O2 exhibits a low diffusion barrier, indicating high mobility in interstellar water ices. Moreover, we suggest these water ices likely retain a residual fraction of hypervolatiles entrapped within their structure.
Key words: astrochemistry / diffusion / molecular processes / methods: laboratory: solid state / ISM: molecules
51 Pegasi b Fellow.
© The Authors 2026
 Open Access article, published by EDP Sciences, under the terms of the Creative Commons Attribution License (https://creativecommons.org/licenses/by/4.0), which permits unrestricted use, distribution, and reproduction in any medium, provided the original work is properly cited.
This article is published in open access under the Subscribe to Open model. This email address is being protected from spambots. You need JavaScript enabled to view it. to support open access publication.
1 Introduction
In the interstellar medium (ISM), molecular clouds are composed of 99% gas by mass, where reactions are unlikely to occur because the molecular density rarely exceeds 100 molecules per cm−3 (Lammer et al. 2009; Gent et al. 2013), and 1% dust (Linnartz et al. 2015). In the coldest regions, where temperatures drop below 20 K, gaseous atoms and molecules freeze out onto dust grains, forming ice mantles where complex chemical processes take place (Boogert et al. 2023; McClure et al. 2023). This solid phase provides reactive sites for the formation of simple and complex organics, owing to its higher reactant concentration and its role as a third body capable of dissipating excess energy from the reaction, and thus stabilizing the products (van Dishoeck 2014; Linnartz et al. 2015; Cuppen et al. 2017; Öberg & Bergin 2021).
Even though this rich ice chemistry can proceed through non-diffusive mechanisms, it is largely facilitated by diffusion (Ligterink et al. 2025), a thermally activated process whereby molecular mobility enables molecules to meet and react. At the prestellar cloud stages, when the temperatures are very low, small hypervolatile species like H atoms can diffuse and initiate reactions (e.g., hydrogenation) with already adsorbed atoms and molecules such as atomic and molecular oxygen (O and O2; Ioppolo et al. 2010). These reaction pathways mainly lead to the formation of amorphous solid water (ASW, H2O; Cuppen et al. 2010), the major component of interstellar ices (Dartois 2005). In addition, under these conditions, a fraction of O2 molecules might not react and are expected to be mixed within these waterrich ice layers (Boogert et al. 2023). Moreover, when a protostar forms and heats its surroundings, the ice undergoes thermal processing that restructures its morphology and modifies diffusion properties; as diffusion rates increase, molecular complexity rises (Minissale et al. 2013). Indeed, with heating of the ice, additional diffusion of the small organics leads to the formation of more complex molecules (Herbst & van Dishoeck 2009; Öberg & Bergin 2021; Ligterink et al. 2025), constituting a vast reservoir of molecular diversity. The efficiency of ice chemistry is therefore heavily controlled by the O2 and other reactants’ diffusion. The warm-up episodes induce molecular desorption in the gas phase even though some species remain entrapped in the ice matrix. In the end, the exact balance between the competing processes of diffusion, entrapment, and desorption dictates the composition of the solid and gas phases during star formation (Minissale et al. 2016b).
At temperatures typically below 140 K, surface diffusion, governed by the Langmuir–Hinshelwood process, is the dominant mechanism and takes place on either an external surface or within internal pores and cracks of the ice (Mispelaer et al. 2013; Lauck et al. 2015; Ligterink et al. 2025). This process is believed to occur by thermal hopping over energy barriers or by quantum tunneling, prevailing at very low temperatures (<10 K; Minissale et al. 2013). On the other hand, at higher temperatures the ice gets more compact (Bossa et al. 2012) and bulk diffusion becomes the main mechanism. Modeled as a swapping process or as movement into interstitial spaces between molecules, bulk diffusion possesses higher energy barriers (Mispelaer et al. 2013; Lauck et al. 2015).
Having access to diffusion parameters of various molecular species of icy astrochemical environments helps us to understand and predict the chemical evolution of star-forming regions. Accurately determined diffusion coefficients, experimentally or theoretically, are essential inputs in astronomical models (Hasegawa et al. 1992; Acharyya 2022; Dijkhuis et al. 2026), but are often poorly constrained and might vary by orders of magnitude. Indeed, diffusion itself is challenging to study as diffusion barriers are usually inferred from diffusion-limited processes (Cuppen et al. 2024). However, because only a few species, for example CO (Lauck et al. 2015) and CH4 (Maté et al. 2020), display such behavior in a measurable way and instrumental sensitivity often imposes additional constraints, the set of molecules for which diffusion barriers can be extracted remains limited. To deal with this lack of data, modelers established various ratios (0.3–0.8; Tielens & Hagen 1982; Garrod & Pauly 2011; Chang & Herbst 2012) to derive diffusion coefficients from the binding energies, a parameter easier to determine, although this introduces large uncertainties in their models (Cuppen et al. 2024; Furuya et al. 2022).
Several previous experimental studies using different techniques under ultrahigh vacuum (UHV) conditions have therefore aimed to accurately determine these diffusion coefficients to complement theoretical investigations. A common way to extract those of stable species is by using infrared (IR) spectroscopy on layered or mixed ices, allowing for the monitoring of target species diffusion during an isothermal experiment. For instance, data are largely available for the surface diffusion of CO in ASW ice at low temperatures (≤50 K). Öberg et al. (2009) and Karssemeijer et al. (2013) determined a similar diffusion energy barrier for CO of 26 ± 9 meV (300 ± 100 K) and 26 ± 15 meV (302 ± 174 K), respectively, while Mispelaer et al. (2013) reported a lower energy barrier with a value of 10 ± 15 meV (116 ± 174 K), and Lauck et al. (2015) established a diffusion energy barrier of 14 ± 1 meV (158 ± 12 K). These results not only show typical values for diffusion energy barriers of a diatomic molecule in ASW but also the importance of taking into account uncertainties and variabilities between results. Studying the diffusion of unstable species such as radicals is more challenging. Some techniques rely on following diffusionlimited processes such as the formation of specific products. Considering the diffusion of O atoms, one way to extract their diffusion coefficients is by monitoring O2 and O3 formation using mass spectrometry (Minissale et al. 2016a). Sometimes, studying the diffusion of stable molecules can also prove challenging. For instance, homonuclear diatomic species such as O2 cannot be as easily monitored as CO because of their IR-inactive nature. Consequently, O2 remains poorly described in models, despite being of clear astrochemical interest: it is expected to be a major reservoir of elemental oxygen in dense molecular clouds (Herbst & Klemperer 1973) and, once adsorbed on icy dust grains, its diffusion is likely to play a major role in increasing the molecular complexity of the ice phase (Taquet et al. 2016; Ligterink et al. 2025). To the best of our knowledge, O2 diffusion in ASW has only been experimentally studied once, indirectly, by probing its impact on the water O–H stretching mode through IR spectroscopy (He et al. 2018).
Here, we present an alternative approach in which O2 kinetics, in initially layered O2–H2O interstellar ice analogs, is directly monitored using mass spectrometry upon surface diffusion followed by instant desorption into the gas phase. This study aims to determine the diffusion energy barrier of O2 in ASW by measuring its Fickian diffusion coefficients (D) at different temperatures (35, 40, and 45 K), ensuring that diffusion is the limiting process compared to desorption. The D values are expected to be temperature-dependent and follow an Arrhenius trend. This technique opens up possibilities for the determination of the diffusion coefficients of other IR-inactive species such as N2 or noble gases. The entrapment efficiency of O2 in H2O as a function of temperature has also been investigated in the present work.
Section 2 describes the experimental setup and procedures, as well as the details for quadrupole mass spectrometer (QMS) monitoring and data analysis using a Fickian equation. It also motivates the choice of the Fickian equation for fitting the experimental data and extracting the diffusion parameters. Section 3 reports the derived diffusion coefficients of O2 and 18O2, and discusses their dependence on temperature and ice thickness. The extracted diffusion energy barrier and entrapment efficiencies in H2O ice are also presented in this section. The astrophysical implications of the newly obtained values are highlighted in Sect. 4, before we conclude with the main findings in Sect. 5.
2 Methods
2.1 Experimental setup
The experiments were conducted in the UHV setup SURFRESIDE3, which has already been described in detail by Ioppolo et al. (2013), Qasim et al. (2020), and Santos (2025). It consists of a main chamber reaching a typical base pressure of ~3 × 10⁻⁹ mbar at room temperature and presenting, at its center, a gold-plated copper substrate mounted on the tip of a closed-cycle helium cryostat. The substrate temperature can be adjusted between 9 and 450 K using resistive heaters and is controlled with a precision of ±0.5 K using two silicon diode sensors. Gases of O2 (Linde, purity 99.9%) and 18O2 (Campro, 97% atom 18O) as well as vapors from deionized H2O are prepared individually in a separate deposition line. The H2O sample was purified by several freeze-pump-thaw cycles. The species are then introduced sequentially into the main chamber through a high-precision leak valve facing the substrate, allowing for their direct deposition on the cold substrate kept at 10 K. Fourier-transform reflection-absorption infrared spectroscopy (RAIRS) is employed to monitor the ice growth and the H2O structure in real time by recording spectra with 1 cm−1 resolution in the 700–4000 cm−1 range. The gas-phase composition containing desorbing species is sampled using a QMS.
2.2 Experimental procedure
The configuration of the studied ice sample is a bilayer structure composed of a thin O2 layer completely covered by H2O. After cooling down the substrate to 10 K, ten monolayers (MLs) of O2 were deposited at a flow rate of 6.9 × 10¹² molecules cm−2 min−1, determined from previous leak-valve calibration steps. Subsequently, deposition of H2O was performed with variable thicknesses (40, 60, 80 ML) at a flow rate of 2.4 × 10¹³ molecules cm−2 min−1, forming an amorphous and porous water ice layer under the cold deposition conditions. The gas composition within the chamber was monitored throughout deposition using the QMS (Fig. 1). The deposited ice sample was further heated with a ramp of 5 K min−1 to designated temperatures at 25, 30, 35, 40, and 45 K and was then held isothermally. This entire four-hour (three-hour for Exp 1) process constituted the isothermal phase. The thermal process conferred energy to the O2 molecules, enabling them to migrate through the H2O layer toward the surface. The desorbing species were ionized by a 70 eV electron impact and monitored with the QMS. After that, the ice underwent temperature-programmed desorption (TPD), a linear heating to 300 K with a ramp of 5 K min−1. The desorption profile during that phase was used to quantify entrapment efficiencies of the volatiles still present in the ice.
The surface coverage was estimated using two approaches. For H2O, the ice growth was monitored in situ during deposition using RAIRS (Fig. 2) and the final column density was obtained using the IR integrated absorbance (∫ Abs(ν)dν) of the OH stretching band at ~3352 cm−1 and converting it to absolute abundance with a modified Beer-Lambert law:
![Mathematical equation: $\[N_{\mathrm{x}}=\ln 10 \cdot \frac{\int A b s(\nu) \mathrm{d} \nu}{A^{\prime}(X)},\]$](/articles/aa/full_html/2026/03/aa58327-25/aa58327-25-eq1.png) (1)
(1)
with Nx being the species’ column density in molecules cm−2 and A′(X) its apparent absorption band strength in cm molecule−1. Based on values reported by Gerakines et al. (1995), the H2O band strength, A(H2O)O-H str = (2.0 ± 0.4) × 10−16 cm molecule−1, was taken and corrected using a setup-specific conversion factor from transmission to reflection mode of 3.2, measured by Santos et al. (2023) with the same experimental setup. The final NH2O was estimated with a systematic uncertainty of 20% mainly coming from the uncertainty on the adopted band strength value, while additional experimental uncertainties contribute at a smaller level.
For IR-inactive molecules such as O2, the growth needs to be estimated differently. To guide the deposition, the target O2 ice coverage was predicted beforehand according to the Langmuir estimation by following the main chamber pressure1. The final column density (Nx) can be derived from the QMS data by using the following expression (Martín-Doménech et al. 2015):
![Mathematical equation: $\[N_{\mathrm{x}}=k_{\mathrm{QMS}} \cdot \frac{A_{\exp }(m / z)}{\sigma_{\mathrm{x}}^{+} \cdot I_{\mathrm{F}}(z) \cdot F_{\mathrm{F}}(m) \cdot S(m / z)},\]$](/articles/aa/full_html/2026/03/aa58327-25/aa58327-25-eq2.png) (2)
(2)
where kQMS is the proportionality constant of the apparatus, Aexp(m/z) is the integrated desorption signal of a given mass fragment, FF(m) is its fragmentation fraction, and S(m/z) is the corresponding sensitivity of the QMS. The sensitivity factor is setup-dependent and the values were extracted from the noble gas calibration experiment previously done by Chuang (2018). Furthermore, ![Mathematical equation: $\[\sigma_{\mathrm{x}}^{+}\]$](/articles/aa/full_html/2026/03/aa58327-25/aa58327-25-eq3.png) stands for the molecule’s electronic ionization cross section in Å2 and IF(z) is the fraction of ions with charge z (here we use IF(z) = 1). For each of the species studied in this work, the employed parameters are summarized in Table 1. On the other hand, kQMS was measured considering that it is independent of the species and assuming a relatively constant pumping speed for all explored species. In this study, we have kQMS = (7.89 ± 1.76) × 1021 a.u. (see Appendix A), with a 22% uncertainty considered as the main source of error in NO2 estimation. All the final thicknesses were expressed in ML units for ease of comparison across experiments using the convention that 1 ML corresponds to 1015 molecules cm−2.
stands for the molecule’s electronic ionization cross section in Å2 and IF(z) is the fraction of ions with charge z (here we use IF(z) = 1). For each of the species studied in this work, the employed parameters are summarized in Table 1. On the other hand, kQMS was measured considering that it is independent of the species and assuming a relatively constant pumping speed for all explored species. In this study, we have kQMS = (7.89 ± 1.76) × 1021 a.u. (see Appendix A), with a 22% uncertainty considered as the main source of error in NO2 estimation. All the final thicknesses were expressed in ML units for ease of comparison across experiments using the convention that 1 ML corresponds to 1015 molecules cm−2.
The ice thickness of each sample in terms of height (hx in cm) was obtained thanks to the species’ column density (Nx) using the expression
![Mathematical equation: $\[h_{\mathrm{x}}=\frac{N_{\mathrm{x}} \cdot M_{\mathrm{x}}}{\rho_{\mathrm{x}} \cdot N_a},\]$](/articles/aa/full_html/2026/03/aa58327-25/aa58327-25-eq4.png) (3)
(3)
where Mx is the species’ molar mass in g mol−1, Na the Avogadro number in mol−1, ρx the density considering ρO2 = 1.54 g cm−3, ρ18O2 = 1.73 g cm−3 (Fulvio et al. 2009), and ρH2O = 0.60–0.66 g cm−3 depending on the experimental temperature (Brown et al. 1996). The total thickness, h, corresponding to the sum of the oxygen (hO2) and water (hH2O) heights was estimated with an uncertainty of 17 and 18% for O2–H2O and 18O2–H2O samples, respectively, based on error propagation from the uncertainties on the column densities.
All experiments performed in this study are summarized in Table 2. It includes control experiments with 18O2, pure H2O ice, or longer isothermal phase, and mentions repeated experiments conducted to assess reproducibility, giving an experimental uncertainty of about 14% on the QMS signal.
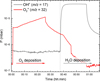 |
Fig. 1 QMS signals recorded during the consecutive deposition of O2 at m/z = 32 and H2O at m/z = 17. |
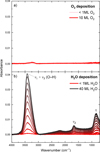 |
Fig. 2 Infrared spectra recorded for experiment 4a during the consecutive deposition of O2 (a) and H2O (b), over the 400–4000 cm−1 range. Top (a): no IR band is observed. The small feature around 3300 cm−1 corresponds to saturation of the water feature from crystallized water in the MCT detector. Bottom (b): ν1 + ν3 corresponds to the O–H stretching mode, ν2 to the H2O bending mode, and τ to the water libration mode. The increase in the intensity of these bands over time reflects the growth of the H2O ice thickness. For readability, only the first and last spectra are indicated in the legends. |
Parameters used to quantify the species’ abundances with the QMS.
2.3 The analysis
2.3.1 Determination of diffusion coefficients and diffusion energy barrier
At a given temperature, the concentration profile of a diffusing species, n(z, t), as a function of time, t, and position z, follows Fick’s second law of diffusion in one dimension:
![Mathematical equation: $\[\frac{\partial n(z, t)}{\partial t}=D(T) \cdot \frac{\partial^2 n(z, t)}{\partial z^2}.\]$](/articles/aa/full_html/2026/03/aa58327-25/aa58327-25-eq5.png) (4)
(4)
Given the successful use of this approach in previous studies on CO diffusion in ASW (Mispelaer et al. 2013; Karssemeijer et al. 2013; Lauck et al. 2015), this Fickian law, described by the temperature-dependent diffusion constant, D, was chosen to model O2 diffusion in ASW, assuming that it is the dominant mechanism. In the present study, the hypothesis of a homogeneous pre-mixed O2–H2O ice when starting the diffusion analysis (see Sect. 3.1.1) imposes the initial condition n(z, 0) = n0 for 0 < z < h, where h denotes the total ice thickness. In addition, we set n(h, t) = 0, reflecting the immediate desorption of O2 upon reaching the ice surface (see Sect. 3.1.1), and ![Mathematical equation: $\[\frac{\partial n(0, t)}{\partial z}=0\]$](/articles/aa/full_html/2026/03/aa58327-25/aa58327-25-eq6.png) , indicating the absence of any O2 desorption flux from the bottom of the ice. Using these boundary conditions, the resulting solution, n(z, t), follows the formulation described by Karssemeijer et al. (2013):
, indicating the absence of any O2 desorption flux from the bottom of the ice. Using these boundary conditions, the resulting solution, n(z, t), follows the formulation described by Karssemeijer et al. (2013):
![Mathematical equation: $\[n(z, t)=\sum_{i=0}^{\infty} \frac{2 n_0(-1)^i}{\mu_i \cdot h} \cdot ~\cos \left(\mu_i \cdot z\right) \cdot ~\exp \left(-\mu_i^2 \cdot D \cdot t\right),\]$](/articles/aa/full_html/2026/03/aa58327-25/aa58327-25-eq7.png) (5)
(5)
with ![Mathematical equation: $\[\mu_{i}=\frac{(2 i{+}1) {\cdot} \pi}{2 h}\]$](/articles/aa/full_html/2026/03/aa58327-25/aa58327-25-eq8.png) , and D being the diffusion coefficient. By integrating this expression over z between 0 and h, the column density of diffusing O2 can be expressed and subsequently converted into QMS signal areas, A(t), following the approach of Karssemeijer et al. (2013). However, unlike IR band areas that probe the remaining molecules in the sample, this study relies on QMS monitoring that records the molecules desorbing over time. Therefore, experimental data accounting for the amount of O2 molecules diffusing within the ice were defined by A(t) = A0 − Aexp(t), where A0 is the total integrated area of desorbing O2 during the isothermal phase and Aexp(t) is the integrated desorption signal of O2 during the same phase. The data were taken from the maximum of the isothermal desorption peak until the plateau reached just before the start of the TPD, and were fit using the following final expression:
, and D being the diffusion coefficient. By integrating this expression over z between 0 and h, the column density of diffusing O2 can be expressed and subsequently converted into QMS signal areas, A(t), following the approach of Karssemeijer et al. (2013). However, unlike IR band areas that probe the remaining molecules in the sample, this study relies on QMS monitoring that records the molecules desorbing over time. Therefore, experimental data accounting for the amount of O2 molecules diffusing within the ice were defined by A(t) = A0 − Aexp(t), where A0 is the total integrated area of desorbing O2 during the isothermal phase and Aexp(t) is the integrated desorption signal of O2 during the same phase. The data were taken from the maximum of the isothermal desorption peak until the plateau reached just before the start of the TPD, and were fit using the following final expression:
![Mathematical equation: $\[A(t)=s+\sum_{i=0}^{\infty} \frac{2\left(A_0-s\right)}{\mu_i^2 \cdot h^2} \cdot ~\exp (-\mu_i^2 \cdot D \cdot t),\]$](/articles/aa/full_html/2026/03/aa58327-25/aa58327-25-eq9.png) (6)
(6)
where s is an experimental offset introduced to reproduce the experimental data, expected to remain close to zero in our case2 (see Table 3). The fixed parameters A0 and h were obtained from spectroscopic measurements, while D and s were treated as free parameters and derived from the fit together with their associated uncertainties.
Considering that diffusion is an Arrhenius-type process, we subsequently used the diffusion coefficients, D, obtained at different isothermal temperatures to derive the diffusion energy barrier, Ediff, using the following Arrhenius equation:
![Mathematical equation: $\[D(T)=D_0 \cdot ~\exp \left(\frac{-E_{\mathrm{diff}}}{k_B \cdot T}\right),\]$](/articles/aa/full_html/2026/03/aa58327-25/aa58327-25-eq10.png) (7)
(7)
where D0 is the pre-exponential factor in cm2 s−1, Ediff is the energy barrier in J, kB is the Boltzmann constant in J K−1, and T is the temperature in K. The energy barrier for diffusion and the pre-exponential factor were extracted by linearly fitting ln(D) at different temperatures versus ![Mathematical equation: $\[\frac{1}{T}\]$](/articles/aa/full_html/2026/03/aa58327-25/aa58327-25-eq11.png) . The uncertainty on Ediff was obtained by performing a Monte Carlo (MC) sampling analysis whereby the initial parameter space was explored using 10 000 simulated independent trials.
. The uncertainty on Ediff was obtained by performing a Monte Carlo (MC) sampling analysis whereby the initial parameter space was explored using 10 000 simulated independent trials.
2.3.2 Entrapment efficiency determination
Instead of diffusing across the ice and reaching the surface, some volatile molecules may remain trapped inside the ice matrix, even well above their sublimation temperature. Once substrate temperatures are high enough and H2O desorbs, it releases the remaining entrapped O2 molecules into the gas phase. Entrapment efficiencies are quantified as the ratio between the integrated area of the late O2 desorption peak in the TPD profile – delimited by the water desorption peak – and the integrated area of the entire O2 desorption profile, from the beginning of the isothermal phase to the end of the TPD run. In other words, we are probing the amount of O2 sublimating together with water, relative to its initial abundance in the ice.
Contamination of the water sample by atmospheric molecular oxygen stemming from the valve in its glass vial was revealed by the presence of a signal in the QMS corresponding to O2 during water deposition (Fig. B.1) and confirmed by a control experiment with water only (experiment 0; see Table 2). Contamination does not impact the diffusion quantification, which is the main focus of our study, as this process is independent of the origin of the O2 molecules. However, it interferes with entrapment efficiencies as preexisting atmospheric O2 molecules already occupy a fraction of the sites in the water ice matrix, leading to a lower apparent entrapment efficiency. For each experiment, entrapment efficiencies were therefore corrected with respect to the initial contamination by using a correlation factor obtained from repeated experiments (Fig. B.2).
Entrapment efficiencies were determined at different temperatures from experiments with fixed total coverage to remove the influence of ice thickness. The uncertainty, estimated at 13%, corresponds to the standard deviation of corrected efficiencies from repeated experiments.
Experimental details for all initially layered O2–H2O, 18O2–H2O, and pure H2O ice experiments.
Fixed parameters used for Fick’s diffusion law analysis of all initially layered O2–H2O experiments, along with their extracted diffusion rate.
3 Results and discussion
3.1 Diffusion in ASW
Diffusion was quantified during the isothermal phase, when O2 molecules desorb from a static water matrix. Figure 3a shows a typical IR spectra (Exp. 4a) taken every 5 minutes during the four-hour isothermal phase presenting the characteristic IR bands (ν1 + ν3, ν2, and τ) of the ASW ice while the O2 mixed with H2O stays IR featureless, as is shown in Fig. 2. It is important to note that a slight increase is observed at the beginning, within 20 minutes, of the isothermal phase in the ν1 + ν3 band, corresponding to +16% in column density, the ν2 bending mode remains similar throughout the whole process. The absence of correlation between these bands rules out the possibility of additional deposition of water at the beginning of the isothermal phase, and instead indicates a slight reorganization of the ice while reaching the set temperature. After about 20 minutes, the water ice stabilizes and the IR spectra remain constant.
3.1.1 Diffusion coefficients
Diffusion coefficients of O2 in ASW were determined from the isothermal phase of the experiments during which molecules diffuse freely. To accurately probe surface diffusion, it is necessary to follow an experimental regime that ensures that diffusion is the limiting process. Consequently, isothermal sequences need to be conducted with high-enough temperatures to guarantee instantaneous desorption and for a long-enough experimental time to prevent any surface residence time effects. O2 diffusion is monitored with QMS using the mass-to-charge (m/z) ratio of 32; the dominant signal corresponding to O2+ molecular ions produced by electron-impact ionization at 70 eV of the desorbing O2 molecules3. On the other hand, the constant signal at m/z = 17 (OH+) attests to the absence of water desorption at the isothermal temperatures. Water is monitored through this channel rather than through the molecular (abundant) mass signal of m/z = 18 (H2O+) of the QMS detector saturation. Figure 4 shows the QMS data from experiments 1 to 7 (Table 2), conducted at different isothermal temperatures (Fig. 4a: 25, 30, 35, 40, and 45 K with 40 ML of H2O) and with different water thicknesses (Fig. 4b: 40, 60, and 80 ML at 40 K). For every experiment, a small feature is observed during the first two minutes of the isothermal phase, corresponding to an artifact resulting from the intense desorption of H2. For temperatures above 35 K, we observe a sharp desorption peak upon reaching the set temperature, followed by an exponential decrease in the signal, ending with a plateau when diffusion is at its minimum. This sharp feature can be attributed to the immediate desorption of weakly bound O2 molecules that have accumulated at the surface. This is likely due in large part to O2 molecules diffusing through the H2O ice layer and accumulating at the surface until their desorption is no longer limited, consistent with the observation that the ices are initially mixed when starting the monitoring of diffusion. However, it is possible that part of this sharp feature may also arise from inhomogeneities of the ice caused by slight deposition of O2 that still lingers in the chamber during and after H2O deposition. Regardless of the source, the sharp peak attributed to loosely bound O2 does not affect our analysis. No such feature is observed at 25 K and 30 K, as the conditions do not ensure immediate desorption. Thus, only experiments in the proper diffusion-dominated regime were retained for further analysis (experiments 3 to 7). Additional 18O2 experiments at different temperatures (35 to 45 K) were carried out to confirm that the diffusion mechanism is independent of water sample contamination (see Fig. C.1 for further explanations).
For every relevant experiment, the experimental decay curves (A(t)) ranging from the maximum of the desorption peak to the plateau were fit to Eq. (6), derived from Fick’s second law of diffusion, where the fixed parameters A0 and h had to be determined (see Sect. 2.2). They correspond, respectively, to the total amount of desorbing O2 during the isothermal phase and the total ice thickness, and are summarized in Table 3. The resulting fits shown in Fig. 5 demonstrate excellent agreement with the experimental data, as is indicated by a coefficient of determination (R2) greater than 0.99 and a χ2 lower than 2.8 × 10⁻⁴. Control 18O2 experiments were also fit to Eq. (6) and display good fit to the experimental data (see Appendix C). As was mentioned in Sect. 2.3.1, diffusion coefficients, D, and the offset, s, were extracted from the fits and are listed in Table 3 alongside their respective uncertainties (see Table C.1 for the isotopolog).
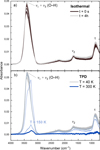 |
Fig. 3 Infrared spectra recorded for experiment 4a during the isothermal (a) and TPD (b) phases, over the 400–4000 cm−1 range. Top (a): spectra were recorded every five minutes for four hours. Bottom (b): spectra were recorded every two minutes during the heating from the isothermal temperature (40 K) to 300 K. At T = 150 K, the abrupt decrease in all characteristic H2O bands is attributed to water desorption. For readability, only the first and last spectra are indicated in the legends. |
3.1.2 Dependence on temperature
Experiments 3 to 5 (at 35 K, 40 K, and 45 K) were used to investigate the effect of temperature on diffusion efficiency. Figure 4a shows that for these experiments the desorption peak becomes more intense as the isothermal temperature increases. Indeed, when additional thermal energy is provided to the system, more O2 molecules are able to instantly desorb upon reaching the set temperature (Minissale et al. 2022).
The measured diffusion coefficients show a clear temperature dependence as their value doubles from (0.5 ± 0.2) to (1.0 ± 0.3) × 10−15 cm2 s−1 when the temperature increases from 35 K to 45 K. This demonstrates that O2 diffusion becomes more efficient as the ASW matrix is heated and microscopic mechanisms such as molecular hopping are activated. In addition, increasing the temperature induces morphological changes and pore rearrangements that further enhance molecular mobility (Jenniskens & Blake 1994; Cazaux et al. 2015; Escribano et al. 2025).
As was mentioned in Sect. 2.3.1, a linear fit of the logarithm of the diffusion coefficients versus ![Mathematical equation: $\[\frac{1}{\text{T}}\]$](/articles/aa/full_html/2026/03/aa58327-25/aa58327-25-eq12.png) was performed (Fig. 6), resulting in a diffusion energy barrier of 10 ± 3 meV (116 ± 35 K). The fit shows excellent agreement with the experimental data, as is indicated by the R2 value of 0.998 for the linear correlation, confirming that diffusion follows an Arrhenius-type behavior. The low value of the diffusion energy barrier explains why O2 diffusion is rapidly activated upon heating of the ice. The value of the pre-exponential factor was also extracted from the linear fit, yielding D0 = (2.3 ± 1.9) × 10−14 cm2 s−1, which represents the theoretical upper limit of the diffusion coefficient as temperature approaches infinity.
was performed (Fig. 6), resulting in a diffusion energy barrier of 10 ± 3 meV (116 ± 35 K). The fit shows excellent agreement with the experimental data, as is indicated by the R2 value of 0.998 for the linear correlation, confirming that diffusion follows an Arrhenius-type behavior. The low value of the diffusion energy barrier explains why O2 diffusion is rapidly activated upon heating of the ice. The value of the pre-exponential factor was also extracted from the linear fit, yielding D0 = (2.3 ± 1.9) × 10−14 cm2 s−1, which represents the theoretical upper limit of the diffusion coefficient as temperature approaches infinity.
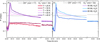 |
Fig. 4 QMS signals recorded during the four-hour isothermal phase at m/z = 17 (OH+) and m/z = 32 (O2+). Left (a): experiments 1 to 5 at different isothermal temperatures (25 K to 45 K with 40 ML of H2O). Right (b): Experiments 4, 6, and 7 with their different water ice thicknesses (40 ML to 80 ML at 40 K). Since the signal at m/z = 17 was identical for every experiment, only the water profile of experiment 4 (T = 40 K; 40 ML H2O) is shown for clarity. |
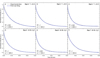 |
Fig. 5 Results of the fits to the Fickian model (blue) for all experimental data (gray) during the 4-hour isothermal phase. Top (a)–(c): fits for experiments 3 to 5 conducted at 35 K, 40 K, and 45 K respectively, with a 40 ML water-ice matrix. Bottom (d)–(f): fits for experiments 4, 6, and 7 conducted at 40 ML, 60 ML, and 80 ML, respectively, for an isothermal temperature of 40 K. |
3.1.3 Dependence on water thickness
Unlike temperature, the diffusion coefficients are expected to be independent of the water ice thickness as long as the initial conditions of the Fickian model remain the same. Experiments 4, 6, and 7 (with H2O ice layers of 40 ML, 60 ML, and 80 ML, respectively) were used to evaluate the effect of the water coverage on diffusion efficiency in our study. Whether considering the first desorption peak observed in the QMS signals (Fig. 4b) or the extracted diffusion coefficients summarized in Table 3, no clear trend with the ice thickness is identified. Although D increases from (0.7 ± 0.3) to (2.0 ± 0.7) × 10−15 cm2 s−1 when going from 40 ML to 60 ML of water ice, it then decreases to (1.8 ± 3.5) × 10−15 cm2 s−1, when the ice is 80 ML thick. The latter’s large uncertainty does not allow for a clear interpretation.
One hypothesis is that ASW undergoes rapid reorganization, even at low temperatures, as is supported by a 16% increase in the ν1 + ν3 band column density (Fig. 3a) during the isothermal phase, and as is described by Slavicinska et al. (2024). This rapid evolution of the ice morphology could lead to a distribution of pore and crack sizes in the ice throughout the isothermal phase. In that situation, the diffusion coefficient measured in a single experiment may in reality correspond to a distribution of diffusion coefficients, as was mentioned by Mispelaer et al. (2013). For thicker ices, this phenomenon can become even more significant and could explain both the absence of a clear trend and the large uncertainties. Another factor that makes this unexpected dependency with thickness difficult to interpret is the uncertainty in the estimated O2/H2O ratios. Indeed, H2O contamination with atmospheric O2 affects the effective O2 coverage, and this phenomenon is exacerbated for thicker H2O ices.
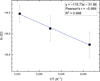 |
Fig. 6 Arrhenius plot showing the O2 diffusion coefficients from experiment 3–5, obtained at different isothermal temperatures (35–45 K) with an ASW thickness of 40 ML. Error bars on ln(D) were determined through a MC analysis based on 10 000 independent trials. |
3.2 Entrapment in ASW
The entrapment of O2 in ASW was studied by analyzing the TPD phase of our experiments. During this phase, IR spectra were recorded every 2 minutes (Fig. 3b), showing two phenomena. Just before T = 150 K, the peak position of the stretching mode shifts to lower wavenumbers, corresponding to water crystallization upon heating of the ice (Maté et al. 2012). Then, a sharp decrease in band intensity of all characteristic H2O IR modes, around 150 K, indicates water desorption.
Figure 7 presents the QMS data recorded from experiments 1 to 7 (Table 2), conducted at different isothermal temperatures (Fig. 7a: 25, 30, 35, 40, and 45 K with 40 ML of H2O) and with different water thicknesses (Fig. 7b: 40, 60, and 80 ML at 40 K). At m/z = 32, the TPD profiles reveal two desorption regimes. The first feature, around 50 K, corresponds to desorption of O2 molecules that did not have sufficient time to diffuse to the surface during the four-hour isothermal phase. As was expected, when the isothermal temperature increases (Fig. 7a), the area of this desorption peak decreases. Indeed, as more O2 molecules diffuse and desorb during the isothermal phase, fewer remain to desorb at the beginning of the TPD. The second desorption feature, occurring around 140–160 K, corresponds to the entrapped O2 molecules that desorb simultaneously with water. This feature increases with the water ice thickness (Fig. 7b), as more sites are available to retain O2 molecules. However, the exact desorption mechanism appears complex and may involve both O2 desorption resulting from the reorganization of the water ice matrix (e.g., volcano desorption upon crystallization) and co-desorption of O2 molecules with water. For completeness, Appendix C shows the results of the control experiments using isotopically labelled dioxygen ices, which agree with the experiments performed for the main isotopolog.
The derived entrapment efficiencies of O2 in ASW from experiments 1 to 5 for initially layered ices following isothermal holds, determined as is described in Sect. 2.3.2, are plotted in Fig. 8, with their 13% relative uncertainty shown as error bars. The efficiencies decrease exponentially, from an initial value of (52 ± 7)% to a lower limit of about 20%, a value that remains constant for all temperatures above 35 K. A similar entrapment efficiency of (23 ± 3)% is obtained for experiment 4 e, conducted with a 30-hour isothermal phase at 40 K and a 40 ML water ice layer. Therefore, even with long diffusion times or elevated temperatures, a relatively constant fraction of about 20% of O2 molecules can remain trapped in ASW.
4 Astrophysical implications
Studying the surface diffusion of O2 in porous ASW ice analogs at low temperatures (≤45 K) helps us to better understand interstellar ice dynamics in dense molecular clouds. In astrochemical models, the diffusion energy barrier is a highly sensitive parameter, and its accurate determination significantly improves the reliability of simulations aimed at studying the ice chemistry of prestellar objects, particularly during the protostar stages (Dijkhuis et al. 2026; Ligterink et al. 2025). Because of the lack of experimental measurements of diffusion coefficients and, consequently, diffusion energy barriers, astrochemical models often rely on generic ratios, ![Mathematical equation: $\[\chi=\frac{E_{\text {diff}}}{E_{\text {des}}}\]$](/articles/aa/full_html/2026/03/aa58327-25/aa58327-25-eq13.png) (Tielens & Hagen 1982; Garrod & Pauly 2011; Chang & Herbst 2012), without explicitly accounting for the specific species, the ice morphology, or the physical conditions. For example, Minissale et al. (2016a) considered χ = 0.7, while Taquet et al. (2016) adopted an average value of 0.5, obtaining very different results for O2 dynamics.
(Tielens & Hagen 1982; Garrod & Pauly 2011; Chang & Herbst 2012), without explicitly accounting for the specific species, the ice morphology, or the physical conditions. For example, Minissale et al. (2016a) considered χ = 0.7, while Taquet et al. (2016) adopted an average value of 0.5, obtaining very different results for O2 dynamics.
In this study, we derived O2 diffusion coefficients on the order of 10−16 to 10−15 cm2 s−1 for temperatures between 35 and 45 K (Table 3). These values are consistent with those reported in the literature for other small hypervolatiles such as CO, which span 10−18–10−12 cm2 s−1 over the temperature range 12–50 K (Karssemeijer et al. 2013; Lauck et al. 2015). Using the Arrhenius law, we extracted a diffusion energy barrier of 10 ± 3 meV (116 ± 35 K) for O2 in ASW, which is lower than the experimental value reported by He et al. (2018), who measured Ediff = 38 ± 1 meV (446 ± 12 K), by monitoring the effect of O2 diffusion on the dangling-OH band strength of H2O ice. This work provides a direct laboratory constraint on the diffusion energy of IR-inactive O2 molecules by applying Fick’s law to its quantified diffusion-limited desorption. The approach used here and that of He et al. (2018) are complementary as they indirectly probe O2 diffusion using different techniques. Regardless, the determination of the diffusion energy barrier can yield distributed results, as is observed in studies on CO diffusion in ASW, with values ranging from 10 ± 15 to 30 ± 4 meV (116 ± 174 to 350 ± 50 K; Mispelaer et al. 2013; Karssemeijer et al. 2013; Lauck et al. 2015; Kouchi et al. 2020). Such variability arises because even slight differences in experimental conditions can alter the ice structure and, consequently, the measured diffusion energy barrier. The relatively low value for the O2 diffusion energy barrier reveals that this process is easily activated, even at low temperatures, a behavior also observed for H atoms (Ediff = 20 meV (232 K); Watanabe et al. 2010) or CO molecules (Ediff = 14 ± 1 meV (158 ± 12 K); Lauck et al. 2015). Based on Edes = 1107 K, given by Minissale et al. (2022) for the desorption energy barrier of O2, we experimentally determined χ to lie between 0.07 and 0.14. This ratio is clearly smaller than the values typically used in astrochemical models for O2 dynamics, highlighting the importance of using specific experimentally determined ratios. Nevertheless, note that no desorption energy was determined in this study, which introduces uncertainties stemming from potential differences in experimental conditions that could affect this value. Moreover, the χ ratios strongly depend on the solid-state conditions and the molecule. For instance, Furuya et al. (2022) experimentally found χ to range between 0.14 and 0.73 for CH4, H2S, OCS, CH3CN, and CH3OH, showing that ratios can hardly be predicted unless experimentally derived under the relevant conditions.
We also extracted entrapment efficiencies for initially layered ices that experienced isothermal holds of 25–45 K for 3–4 h. They approximately range between 50% at 25 K and 20% at 45 K. These results are comparable to what has been reported for similar subsets of hypervolatile atoms and molecules even though the many experimental differences found across the literature do not allow us to determine the existence of universal entrapment fractions. For diatomic hypervolatile molecules such as CO in water ice with the closest possible conditions to our work (4:1, H2O: O2, 50 ML), Simon et al. (2023) and Pesciotta et al. (2024) both report an entrapment efficiency of 29% for, respectively, 3:1 (H2O:13CO, 69 ML) and 5:1 (H2O:13CO, 51 ML) initially mixed ices. Moreover, small and nonpolar species such as Ar and N2 are reported to exhibit entrapment efficiencies of 24 and 19%, respectively, in initially mixed 4.7:1 (H2O: Ar, 23 ML) and 2.9:1 (H2O: N2, 71 ML) ices (Simon et al. 2023). These values are remarkably consistent with the entrapment efficiencies derived in this work, despite the many differences in experimental conditions. In comparison, H2S, a water-like molecule, is shown to be entrapped at 76% in initially mixed 5:1 (H2O: H2S, 40 ML) ices (Santos et al. 2025). The much higher value for H2S suggests that entrapment efficiencies can only be similar for atoms and molecules that are comparable in their properties. In this study, we determined a minimum entrapment fraction of 20% for O2 in ASW at the highest temperatures and longest timescales of the isothermal phase. Because the entrapment efficiency reaches a plateau, we demonstrated that, even in the ISM where heating timescales are much longer than in the laboratory, interstellar ices may always contain a residual amount of entrapped volatiles such as O2, which will remain stuck in the ice until desorbing with water. A similar minimum entrapment fraction may also exist for other hypervolatiles. Indeed Simon et al. (2023) reported that CO entrapment efficiencies in initially mixed 10:1 (H2O:13CO, 52–58 ML) ice decreases from 61% when deposited at 12 K to 46% when deposited at both 20 and 30 K. These experimental findings are consistent with previous observations; for example, ones highlighting the importance of taking into account entrapment to understand hypervolatiles distribution across protoplanetary disks (Bergner et al. 2024).
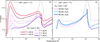 |
Fig. 7 QMS signals recorded during the TPD phase at m/z = 17 (OH+) and m/z = 32 (O2+). Left (a): experiments 1 to 5 at different isothermal temperatures (25–45 K with 40 ML of H2O). Right (b): experiments 4,6, and 7 with their different water ice thicknesses (40–80 ML at 40 K). Since the signal at m/z = 17, showing water desorption peaking at around 150 K, was identical for every experiment, only the water profile of experiment 4 (T = 40 K; 40 ML H2O) is shown for clarity. |
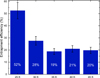 |
Fig. 8 Corrected entrapment efficiencies of O2 in ASW ice derived from experiments performed at different isothermal temperatures (25–45 K). Error bars were estimated as ±13% of measured values. |
5 Conclusions
In this study, the surface diffusion behavior of O2 in porous ASW has been quantified by monitoring, for the first time, the diffusion-limited desorption of O2 molecules using mass spectrometry. This new approach enables a comprehensive characterization of the diffusion of IR-inactive molecules in a more straightforward way, while remaining agnostic about the ice matrix, i.e., it does not rely on the IR monitoring of another deposited species. The surface diffusion energy barrier was determined by extracting the diffusion coefficients at different isothermal temperatures (35, 40, and 45 K), and the O2 entrapment efficiencies in the ASW were also measured. The main experimental findings are concluded as follows:
We obtain diffusion coefficients for O2 molecules in porous ASW at different astronomically relevant temperatures. From 35 to 45 K, the diffusion coefficients range from (0.5 ± 0.2) to (1.0 ± 0.3) × 10−15 cm2 s−1. With increasing water coverage, O2 diffusion coefficients range between (0.7–2) × 10−15 cm2 s−1.
By fitting the Arrhenius equation, we derive a diffusion energy barrier of 10 ± 3 meV (116 ± 35 K) for the diffusion of O2 in ASW, with a pre-exponential factor of D0 = (2.3 ± 1.9) × 10−14 cm2 s−1. Compared to other small volatiles, this energy barrier is relatively low, yielding a χ ratio of ~0.1, which highlights an easier mobility of O2 molecules in the water matrix than was previously expected.
The entrapment efficiency of O2 in ASW ice shows a strong temperature dependence from 25 to 35 K, decreasing from ~52 to ~20%. However, the entrapment fraction remains roughly constant at ~20% in laboratory measurements up to 45 K, or even over relatively long timescales.
These results provide new constraints on O2 surface diffusion and entrapment in porous ASW. The characterised diffusion coefficients and energy barrier will help in astrochemical modeling, which emphasizes the importance of accurately determining them for future model implementations. It also opens possibilities for future studies aimed at quantifying the diffusion parameters of other IR-inactive molecules such as N2 or noble gases. On the other hand, the entrapment efficiencies can be further investigated using higher isothermal temperatures and other hypervolatiles to confirm the trend in which small molecules, such as O2, remain trapped within the ice matrix well above their nominal sublimation temperature.
Acknowledgements
L.C. was supported by the ERASMUS+ grant financed by the European Union. J.C.S. was supported by the Heising-Simons Foundation through a 51 Pegasi b Fellowship and by the Danish National Research Foundation through the Center of Excellence “InterCat” (Grant agreement no.: DNRF150)
References
- Acharyya, K. 2022, PASA, 39, e009 [NASA ADS] [CrossRef] [Google Scholar]
- Bergner, J. B., Sturm, J., Piacentino, E. L., et al. 2024, ApJ, 975, 166 [NASA ADS] [CrossRef] [Google Scholar]
- Boogert, A. A., Gerakines, P. A., & Whittet, D. C. 2023, Annu. Rev. Astron. Astrophys., 53, 541 [Google Scholar]
- Bossa, J.-B., Isokoski, K., De Valois, M., & Linnartz, H. 2012, A&A, 545, A82 [NASA ADS] [CrossRef] [EDP Sciences] [Google Scholar]
- Brown, D., George, S. M., Huang, C., et al. 1996, J. Phys. Chem., 100, 4988 [Google Scholar]
- Cazaux, S., Bossa, J.-B., Linnartz, H., & Tielens, A. 2015, A&A, 573, A16 [NASA ADS] [CrossRef] [EDP Sciences] [Google Scholar]
- Chang, Q., & Herbst, E. 2012, ApJ, 759, 147 [Google Scholar]
- Chuang, K.-J. 2018, PhD thesis, Leiden University, The Netherlands [Google Scholar]
- Cuppen, H., Ioppolo, S., Romanzin, C., & Linnartz, H. 2010, Phys. Chem. Chem. Phys., 12, 12077 [NASA ADS] [CrossRef] [Google Scholar]
- Cuppen, H., Walsh, C., Lamberts, T., et al. 2017, Space Sci. Rev., 212, 1 [NASA ADS] [CrossRef] [Google Scholar]
- Cuppen, H. M., Linnartz, H., & Ioppolo, S. 2024, Annu. Rev. Astron. Astrophys., 62 [Google Scholar]
- Dartois, E. 2005, Space Sci. Rev., 119, 293 [NASA ADS] [CrossRef] [Google Scholar]
- Dijkhuis, T. M., Lamberts, T., Viti, S., & Cuppen, H. M. 2026, A&A, 706, A172 [NASA ADS] [CrossRef] [EDP Sciences] [Google Scholar]
- Escribano, B., del Burgo Olivares, C., Carrascosa, H., et al. 2025, A&A, 699, A79 [NASA ADS] [CrossRef] [EDP Sciences] [Google Scholar]
- Fulvio, D., Sivaraman, B., Baratta, G., Palumbo, M., & Mason, N. 2009, Spectrochim. Acta, Part A, 72, 1007 [Google Scholar]
- Furuya, K., Hama, T., Oba, Y., et al. 2022, ApJ, 933, L16 [CrossRef] [Google Scholar]
- Garrod, R. T., & Pauly, T. 2011, ApJ, 735, 15 [Google Scholar]
- Gent, F., Shukurov, A., Fletcher, A., Sarson, G., & Mantere, M. 2013, MNRAS, 432, 1396 [NASA ADS] [CrossRef] [Google Scholar]
- Gerakines, P. A., Schutte, W., Greenberg, J., & van Dishoeck, E. F. 1995, A&A, 296, A810 [Google Scholar]
- Hasegawa, T. I., Herbst, E., & Leung, C. M. 1992, ApJS, 82, 167 [Google Scholar]
- He, J., Emtiaz, S., & Vidali, G. 2018, ApJ, 863, 156 [CrossRef] [Google Scholar]
- Herbst, E., & Klemperer, W. 1973, ApJ, 185, 505 [Google Scholar]
- Herbst, E., & van Dishoeck, E. F. 2009, Annu. Rev. Astron. Astrophys., 47, 427 [Google Scholar]
- Ioppolo, S., Cuppen, H. M., Romanzin, C., van Dishoeck, E. F., & Linnartz, H. 2010, Phys. Chem. Chem. Phys., 12, 12065 [Google Scholar]
- Ioppolo, S., Fedoseev, G., Lamberts, T., Romanzin, C., & Linnartz, H. 2013, Rev. Sci. Instrum., 84, 7 [Google Scholar]
- Itikawa, Y., & Mason, N. 2005, J. Phys. Chem. Ref. Data, 34, 1 [Google Scholar]
- Jenniskens, P., & Blake, D. F. 1994, Science, 265, 753 [NASA ADS] [CrossRef] [Google Scholar]
- Karssemeijer, L., Ioppolo, S., Van Hemert, M., et al. 2013, ApJ, 781, 16 [Google Scholar]
- Kouchi, A., Furuya, K., Hama, T., et al. 2020, ApJ, 891, L22 [NASA ADS] [CrossRef] [Google Scholar]
- Krishnakumar, E., & Srivastava, S. 1992, Int. J. Mass Spectrom. Ion Process., 113, 1 [Google Scholar]
- Lammer, H., Bredehöft, J., Coustenis, A., et al. 2009, Astron. Astrophys. Rev., 17, 181 [Google Scholar]
- Lauck, T., Karssemeijer, L., Shulenberger, K., et al. 2015, ApJ, 801, 118 [Google Scholar]
- Ligterink, N., Walsh, C., Cuppen, H., et al. 2025, Phys. Chem. Chem. Phys., 27, 19630 [Google Scholar]
- Linnartz, H., Ioppolo, S., & Fedoseev, G. 2015, Int. Rev. Phys. Chem., 34, 205 [Google Scholar]
- Martín-Doménech, R., Manzano-Santamaría, J., Caro, G. M., et al. 2015, A&A, 584, A14 [NASA ADS] [CrossRef] [EDP Sciences] [Google Scholar]
- Maté, B., Rodríguez-Lazcano, Y., & Herrero, V. J. 2012, Phys. Chem. Chem. Phys., 14, 10595 [Google Scholar]
- Maté, B., Cazaux, S., Satorre, M. Á., et al. 2020, A&A, 643, A163 [NASA ADS] [CrossRef] [EDP Sciences] [Google Scholar]
- McClure, M. K., Rocha, W., Pontoppidan, K., et al. 2023, Nat. Astron., 7, 431 [NASA ADS] [CrossRef] [Google Scholar]
- Minissale, M., Congiu, E., Baouche, S., et al. 2013, Phys. Rev. Lett., 111, 053201 [NASA ADS] [CrossRef] [Google Scholar]
- Minissale, M., Congiu, E., & Dulieu, F. 2016a, A&A, 585, A146 [NASA ADS] [CrossRef] [EDP Sciences] [Google Scholar]
- Minissale, M., Dulieu, F., Cazaux, S., & Hocuk, S. 2016b, A&A, 585, A24 [NASA ADS] [CrossRef] [EDP Sciences] [Google Scholar]
- Minissale, M., Aikawa, Y., Bergin, E., et al. 2022, ACS Earth Space Chem., 6, 597 [NASA ADS] [CrossRef] [Google Scholar]
- Mispelaer, F., Theulé, P., Aouididi, H., et al. 2013, A&A, 555, A13 [NASA ADS] [CrossRef] [EDP Sciences] [Google Scholar]
- Öberg, K. I., & Bergin, E. A. 2021, Phys. Rep., 893, 1 [Google Scholar]
- Öberg, K. I., Fayolle, E. C., Cuppen, H. M., van Dishoeck, E. F., & Linnartz, H. 2009, A&A, 505, 183 [NASA ADS] [CrossRef] [EDP Sciences] [Google Scholar]
- Pesciotta, C., Simon, A., Rajappan, M., & Öberg, K. I. 2024, ApJ, 973, 166 [Google Scholar]
- Qasim, D., Witlox, M., Fedoseev, G., et al. 2020, Rev. Sci. Instrum., 91, 054501 [NASA ADS] [CrossRef] [Google Scholar]
- Santos, J. C. 2025, PhD thesis, Leiden University, The Netherlands [Google Scholar]
- Santos, J. C., Linnartz, H., & Chuang, K.-J. 2023, A&A, 678, A112 [NASA ADS] [CrossRef] [EDP Sciences] [Google Scholar]
- Santos, J. C., Piacentino, E. L., Bergner, J. B., Rajappan, M., & Öberg, K. I. 2025, A&A, 698, A254 [NASA ADS] [CrossRef] [EDP Sciences] [Google Scholar]
- Simon, A., Rajappan, M., & Öberg, K. I. 2023, ApJ, 955, 5 [NASA ADS] [CrossRef] [Google Scholar]
- Slavicinska, K., Van Dishoeck, E. F., Tychoniec, Ł., et al. 2024, A&A, 688, A29 [NASA ADS] [CrossRef] [EDP Sciences] [Google Scholar]
- Taquet, V., Furuya, K., Walsh, C., & van Dishoeck, E. F. 2016, MNRAS, 462, S99 [NASA ADS] [CrossRef] [Google Scholar]
- Tielens, A., & Hagen, W. 1982, A&A, 114, 245 [NASA ADS] [Google Scholar]
- van Dishoeck, E. F. 2014, Faraday Discuss., 168, 9 [NASA ADS] [CrossRef] [Google Scholar]
- Watanabe, N., Kimura, Y., Kouchi, A., et al. 2010, ApJ, 714, L233 [Google Scholar]
Assuming that 1 Langmuir, corresponding to an exposure of 10−6 Torr during one second, leads to the surface coverage of 1 ML.
According to Eq. (6), A(t) converges to s at the end of the isothermal phase. However, A(t) should also converge to 0 at that point, since Aexp(t) gradually achieves A0 value, implying that s = 0 in theory.
Appendix A kQMS determination
The proportionality constant kQMS for this setup was determined by comparing the IR-derived H2O column densities (NH2O) with the ![Mathematical equation: $\[\frac{N_{\mathrm{H}_{2} \mathrm{O}}}{k_{\mathrm{QMS}}}\]$](/articles/aa/full_html/2026/03/aa58327-25/aa58327-25-eq14.png) values from QMS data across all experiments. A mean kQMS value was then extracted along with its standard deviation, yielding kQMS = (7.89 ± 1.76) × 1021 a.u.
values from QMS data across all experiments. A mean kQMS value was then extracted along with its standard deviation, yielding kQMS = (7.89 ± 1.76) × 1021 a.u.
Appendix B Atmospheric O2 contamination in the water sample
Contamination of the water samples by atmospheric O2 is further quantified in this appendix. Figure B.1 illustrates how the level of contamination varies across experiments, while Fig. B.2 shows the linear correlation between contamination and the final amount of entrapped O2. This correlation allows the derivation of a correction factor, subsequently applied to all entrapment efficiency values.
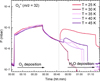 |
Fig. B.1 QMS signals at m/z = 32 recorded during the consecutive deposition of O2 and H2O for five experiments with different isothermal temperatures (T = 25 K, 30 K, 35 K, 40 K, 45 K). The presence of a signal at m/z = 32 during H2O deposition indicates contamination of the water sample by atmospheric O2. |
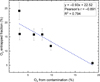 |
Fig. B.2 Linear correlation between fraction of entrapped O2 and the fraction coming from contamination by atmospheric air. The fit is used to correct entrapment efficiencies by extrapolation at 0% contamination. |
Appendix C Isotopically labeled experiments
Figure C.1 shows the QMS signal at m/z = 36 (18O2+) and m/z = 17 (OH+) during the isothermal phase of the isotopic experiments. Similar to what was observed in the non-isotopic experiments, the signal corresponding to the isotopic molecular oxygen cation exhibits a sharp peak at the beginning of the isothermal phase, followed by a similar exponential decay, while water displays a constant profile. This analogous behavior indicates that the diffusion phenomenon is independent of the isotopolog and that possible contamination does not affect the determination of the diffusion coefficients, i.e., confirming that the observed signal for the major isotopolog arises from diffusion through the water ice matrix followed by instantaneous desorption upon reaching the surface. However, in the isotopic experiments, the initial desorption peak does not show a clear evolution, but as 18O2/H2O ratios were systematically lower than the O2/H2O ones, it may cause slight differences in behavior.
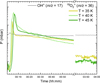 |
Fig. C.1 QMS signals recorded during the four-hour isothermal phase at m/z = 17 (OH+) and m/z = 36 (18O2+) for experiments 8 to 10 at different isothermal temperatures (35 K to 45 K with 40 ML of H2O). Considering the signal at m/z = 17 was the same for every experiment, only the water profile of experiment 9 (T = 40 K) is shown for clarity. |
All isotopic experiments were also fit to Eq. 6 using the fixed parameters listed in Table C.1 The resulting fits are shown in Fig. C.2, and the extracted diffusion coefficients are reported in Table C.1. The fits show excellent agreement with the experimental data, as indicated by R2 values above 0.99 and χ2 values below 2.4 × 10⁻⁵. The extracted diffusion coefficients are within the expected order of magnitude, ranging from (0.5 ± 3.5) to (2.3 ± 4.4) × 10−15 cm2 s−1, but exhibit large uncertainties. Consequently, no further analysis was conducted, as the mechanism cannot be fully constrained. Nevertheless, the consistent fitting of both these isotopically labeled control experiments and the major isotopolog experiments confirms that we are probing the surface diffusion of O2 through ASW from the bottom to the ice surface.
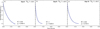 |
Fig. C.2 Results of the fits to the Fickian model (blue) for all experimental data (gray) recorded during the four hour isothermal phase: (a)–(c) correspond to the fits of experiments 8 to 10 conducted at 35 K, 40 K and 45 K respectively, with a 40 ML water-ice matrix. Data is truncated once diffusion ceases, i.e., when the plateau is reached. |
Fixed parameters used for Fick’s diffusion law analysis of all initially layered 18O2–H2O experiments, along with their extracted diffusion rate.
Figure C.3 shows the QMS signal recorded during the TPD of the isotopic experiments. Similar to the non-isotopic experiments, two desorption features are observed at m/z = 36. While the first desorption peak exhibits a behavior comparable to that of regular O2, the absence of a clear trend in the second desorption peak suggests that contamination of the water ice may affect the amount of entrapped 18O2. Indeed, if regular O2 from the air is already present in the water ice matrix and occupies the most favorable trapping sites, it reduces the number of available sites for 18O2 entrapment. However, once corrected for contamination (Sect. 2.3.2), the entrapment efficiencies of 18O2 in ASW (23%, 20%, and 19%, at 35 K, 40 K, and 45 K, respectively) are consistent with those of regular O2, sharing the same lower limit of about 20% of entrapment at high temperatures.
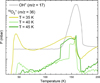 |
Fig. C.3 QMS signals recorded during the TPD phase at m/z = 17 (OH+) and m/z = 36 (18O2+) for experiments 8 to 10 at different isothermal temperatures (35 K to 45 K with 40 ML of H2O). Considering the signal at m/z = 17, showing water desorption peaking at around 150 K, was the same for every experiment, only the water profile of experiment 9 (T = 40 K) is shown for clarity. |
All Tables
Experimental details for all initially layered O2–H2O, 18O2–H2O, and pure H2O ice experiments.
Fixed parameters used for Fick’s diffusion law analysis of all initially layered O2–H2O experiments, along with their extracted diffusion rate.
Fixed parameters used for Fick’s diffusion law analysis of all initially layered 18O2–H2O experiments, along with their extracted diffusion rate.
All Figures
|
Fig. 1 QMS signals recorded during the consecutive deposition of O2 at m/z = 32 and H2O at m/z = 17. |
| In the text | |
|
Fig. 2 Infrared spectra recorded for experiment 4a during the consecutive deposition of O2 (a) and H2O (b), over the 400–4000 cm−1 range. Top (a): no IR band is observed. The small feature around 3300 cm−1 corresponds to saturation of the water feature from crystallized water in the MCT detector. Bottom (b): ν1 + ν3 corresponds to the O–H stretching mode, ν2 to the H2O bending mode, and τ to the water libration mode. The increase in the intensity of these bands over time reflects the growth of the H2O ice thickness. For readability, only the first and last spectra are indicated in the legends. |
| In the text | |
|
Fig. 3 Infrared spectra recorded for experiment 4a during the isothermal (a) and TPD (b) phases, over the 400–4000 cm−1 range. Top (a): spectra were recorded every five minutes for four hours. Bottom (b): spectra were recorded every two minutes during the heating from the isothermal temperature (40 K) to 300 K. At T = 150 K, the abrupt decrease in all characteristic H2O bands is attributed to water desorption. For readability, only the first and last spectra are indicated in the legends. |
| In the text | |
|
Fig. 4 QMS signals recorded during the four-hour isothermal phase at m/z = 17 (OH+) and m/z = 32 (O2+). Left (a): experiments 1 to 5 at different isothermal temperatures (25 K to 45 K with 40 ML of H2O). Right (b): Experiments 4, 6, and 7 with their different water ice thicknesses (40 ML to 80 ML at 40 K). Since the signal at m/z = 17 was identical for every experiment, only the water profile of experiment 4 (T = 40 K; 40 ML H2O) is shown for clarity. |
| In the text | |
|
Fig. 5 Results of the fits to the Fickian model (blue) for all experimental data (gray) during the 4-hour isothermal phase. Top (a)–(c): fits for experiments 3 to 5 conducted at 35 K, 40 K, and 45 K respectively, with a 40 ML water-ice matrix. Bottom (d)–(f): fits for experiments 4, 6, and 7 conducted at 40 ML, 60 ML, and 80 ML, respectively, for an isothermal temperature of 40 K. |
| In the text | |
|
Fig. 6 Arrhenius plot showing the O2 diffusion coefficients from experiment 3–5, obtained at different isothermal temperatures (35–45 K) with an ASW thickness of 40 ML. Error bars on ln(D) were determined through a MC analysis based on 10 000 independent trials. |
| In the text | |
|
Fig. 7 QMS signals recorded during the TPD phase at m/z = 17 (OH+) and m/z = 32 (O2+). Left (a): experiments 1 to 5 at different isothermal temperatures (25–45 K with 40 ML of H2O). Right (b): experiments 4,6, and 7 with their different water ice thicknesses (40–80 ML at 40 K). Since the signal at m/z = 17, showing water desorption peaking at around 150 K, was identical for every experiment, only the water profile of experiment 4 (T = 40 K; 40 ML H2O) is shown for clarity. |
| In the text | |
|
Fig. 8 Corrected entrapment efficiencies of O2 in ASW ice derived from experiments performed at different isothermal temperatures (25–45 K). Error bars were estimated as ±13% of measured values. |
| In the text | |
|
Fig. B.1 QMS signals at m/z = 32 recorded during the consecutive deposition of O2 and H2O for five experiments with different isothermal temperatures (T = 25 K, 30 K, 35 K, 40 K, 45 K). The presence of a signal at m/z = 32 during H2O deposition indicates contamination of the water sample by atmospheric O2. |
| In the text | |
|
Fig. B.2 Linear correlation between fraction of entrapped O2 and the fraction coming from contamination by atmospheric air. The fit is used to correct entrapment efficiencies by extrapolation at 0% contamination. |
| In the text | |
|
Fig. C.1 QMS signals recorded during the four-hour isothermal phase at m/z = 17 (OH+) and m/z = 36 (18O2+) for experiments 8 to 10 at different isothermal temperatures (35 K to 45 K with 40 ML of H2O). Considering the signal at m/z = 17 was the same for every experiment, only the water profile of experiment 9 (T = 40 K) is shown for clarity. |
| In the text | |
|
Fig. C.2 Results of the fits to the Fickian model (blue) for all experimental data (gray) recorded during the four hour isothermal phase: (a)–(c) correspond to the fits of experiments 8 to 10 conducted at 35 K, 40 K and 45 K respectively, with a 40 ML water-ice matrix. Data is truncated once diffusion ceases, i.e., when the plateau is reached. |
| In the text | |
|
Fig. C.3 QMS signals recorded during the TPD phase at m/z = 17 (OH+) and m/z = 36 (18O2+) for experiments 8 to 10 at different isothermal temperatures (35 K to 45 K with 40 ML of H2O). Considering the signal at m/z = 17, showing water desorption peaking at around 150 K, was the same for every experiment, only the water profile of experiment 9 (T = 40 K) is shown for clarity. |
| In the text | |
Current usage metrics show cumulative count of Article Views (full-text article views including HTML views, PDF and ePub downloads, according to the available data) and Abstracts Views on Vision4Press platform.
Data correspond to usage on the plateform after 2015. The current usage metrics is available 48-96 hours after online publication and is updated daily on week days.
Initial download of the metrics may take a while.