Fig. C.3
Download original image
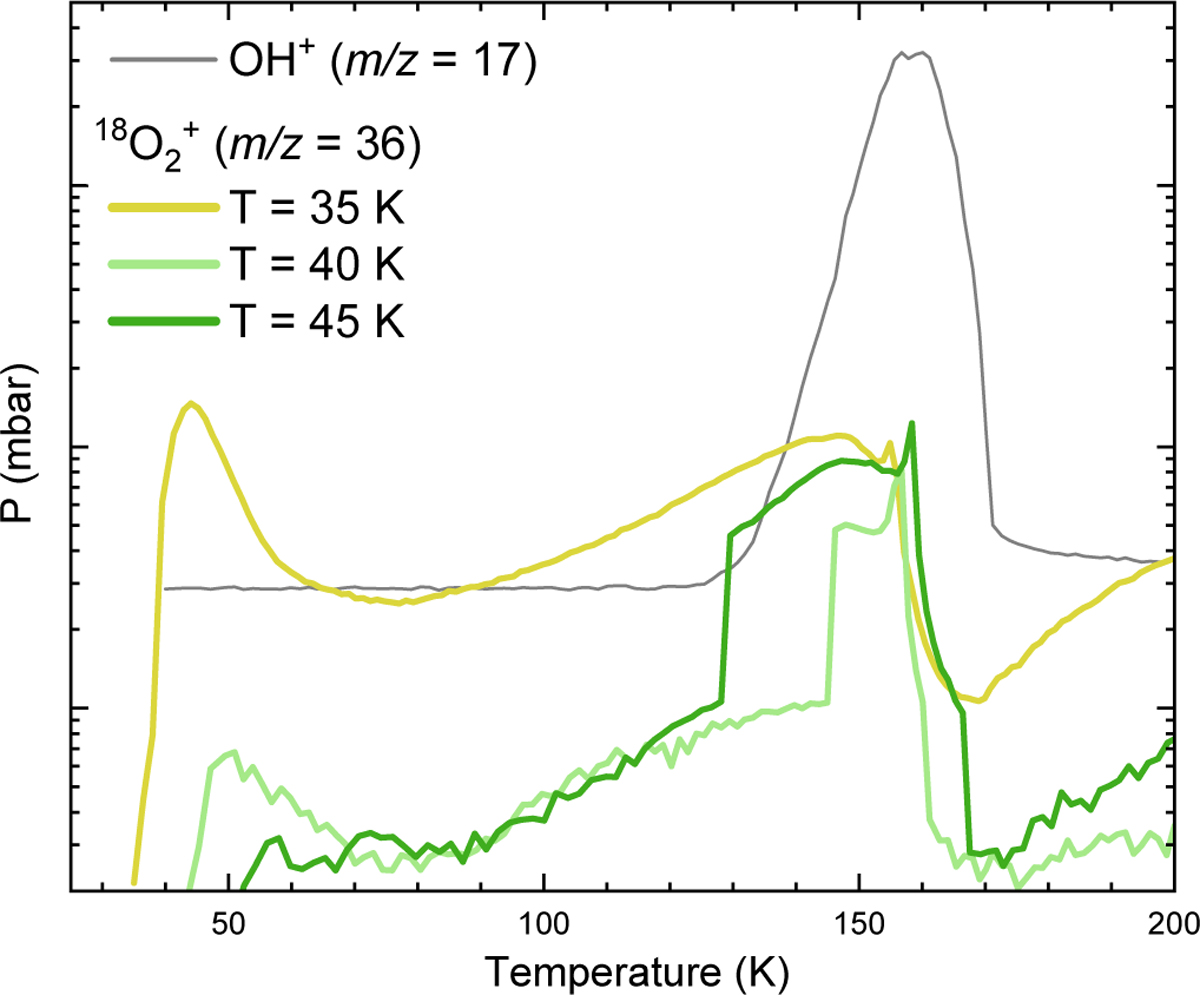
QMS signals recorded during the TPD phase at m/z = 17 (OH+) and m/z = 36 (18O2+) for experiments 8 to 10 at different isothermal temperatures (35 K to 45 K with 40 ML of H2O). Considering the signal at m/z = 17, showing water desorption peaking at around 150 K, was the same for every experiment, only the water profile of experiment 9 (T = 40 K) is shown for clarity.
Current usage metrics show cumulative count of Article Views (full-text article views including HTML views, PDF and ePub downloads, according to the available data) and Abstracts Views on Vision4Press platform.
Data correspond to usage on the plateform after 2015. The current usage metrics is available 48-96 hours after online publication and is updated daily on week days.
Initial download of the metrics may take a while.