Fig. 2
Download original image
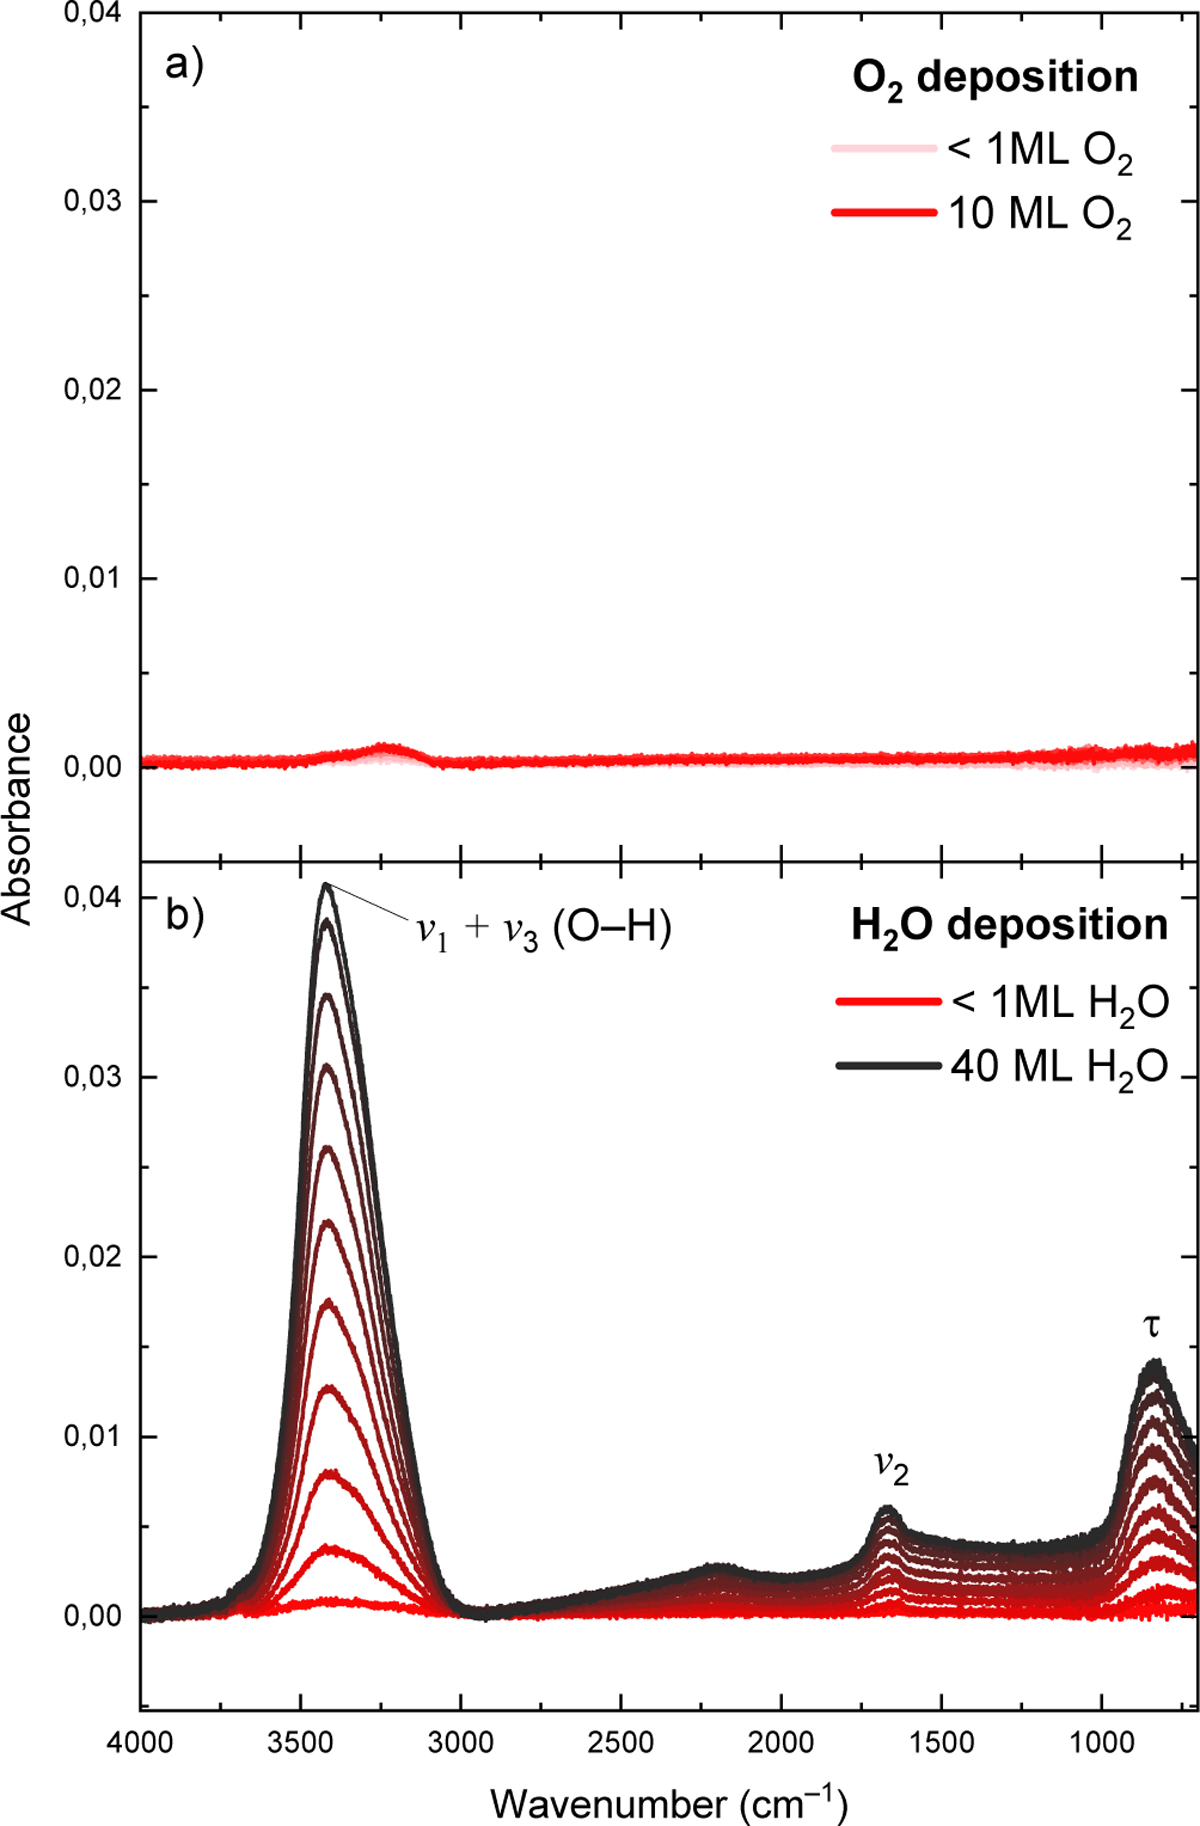
Infrared spectra recorded for experiment 4a during the consecutive deposition of O2 (a) and H2O (b), over the 400–4000 cm−1 range. Top (a): no IR band is observed. The small feature around 3300 cm−1 corresponds to saturation of the water feature from crystallized water in the MCT detector. Bottom (b): ν1 + ν3 corresponds to the O–H stretching mode, ν2 to the H2O bending mode, and τ to the water libration mode. The increase in the intensity of these bands over time reflects the growth of the H2O ice thickness. For readability, only the first and last spectra are indicated in the legends.
Current usage metrics show cumulative count of Article Views (full-text article views including HTML views, PDF and ePub downloads, according to the available data) and Abstracts Views on Vision4Press platform.
Data correspond to usage on the plateform after 2015. The current usage metrics is available 48-96 hours after online publication and is updated daily on week days.
Initial download of the metrics may take a while.