Open Access
Fig. 6
Download original image
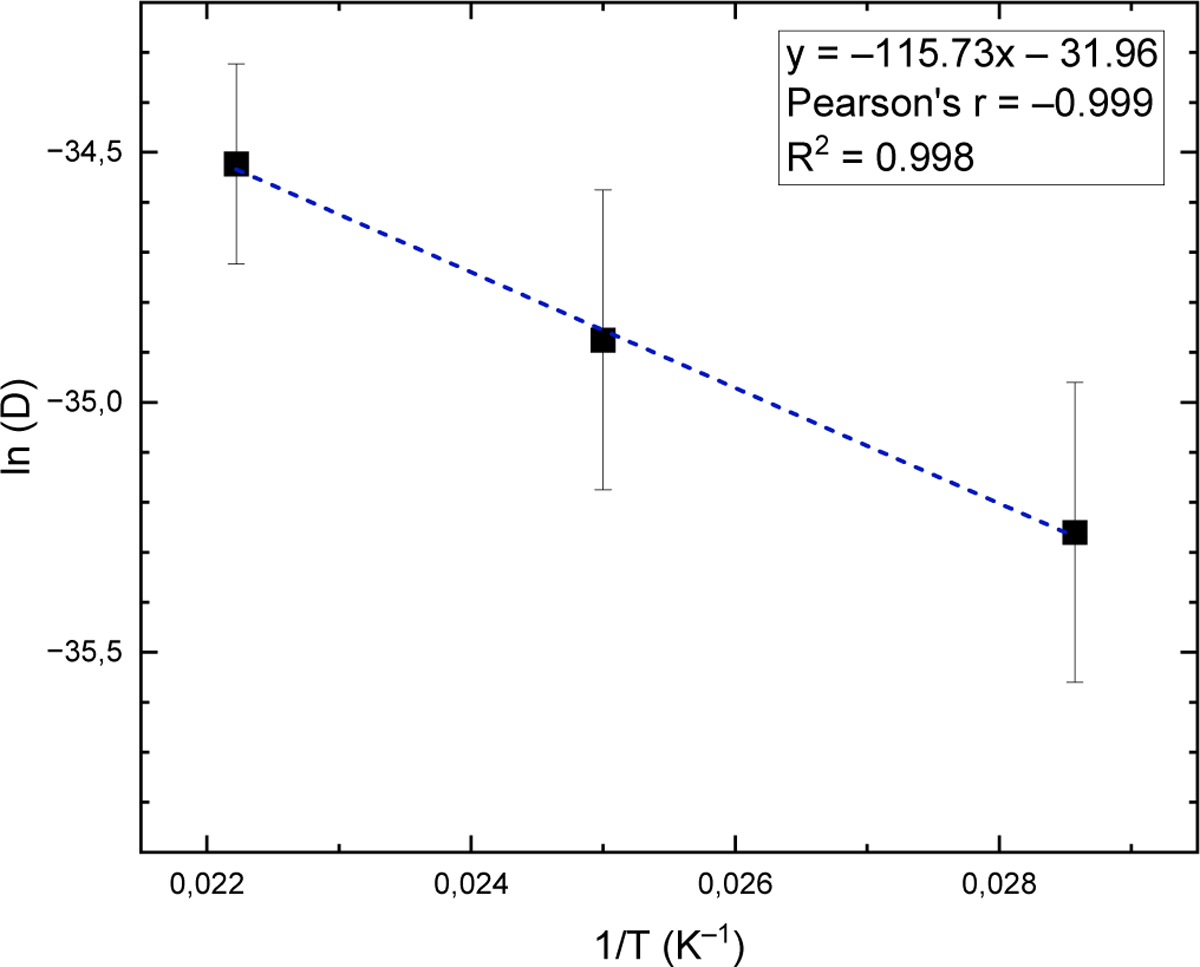
Arrhenius plot showing the O2 diffusion coefficients from experiment 3–5, obtained at different isothermal temperatures (35–45 K) with an ASW thickness of 40 ML. Error bars on ln(D) were determined through a MC analysis based on 10 000 independent trials.
Current usage metrics show cumulative count of Article Views (full-text article views including HTML views, PDF and ePub downloads, according to the available data) and Abstracts Views on Vision4Press platform.
Data correspond to usage on the plateform after 2015. The current usage metrics is available 48-96 hours after online publication and is updated daily on week days.
Initial download of the metrics may take a while.