Fig. 2
Download original image
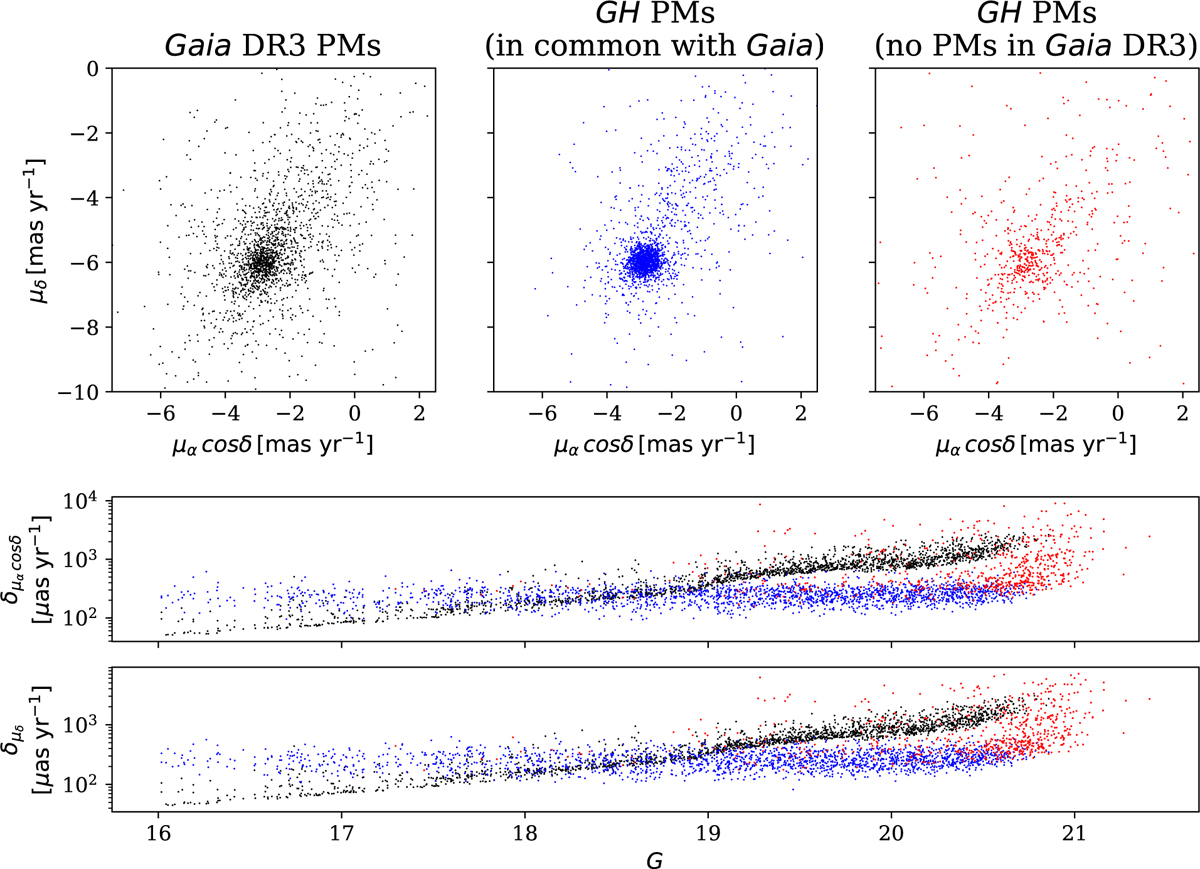
Comparison between the Gaia and GH PMs. The top panels show the VPDs of the PMs, and the two bottom panels show the PM errors along α cos δ and δ as a function of Gaia G magnitude. The black dots refer to the Gaia PMs, and the blue and red dots show stars in our catalog with and without a corresponding PM in the Gaia catalog, respectively.
Current usage metrics show cumulative count of Article Views (full-text article views including HTML views, PDF and ePub downloads, according to the available data) and Abstracts Views on Vision4Press platform.
Data correspond to usage on the plateform after 2015. The current usage metrics is available 48-96 hours after online publication and is updated daily on week days.
Initial download of the metrics may take a while.