Fig. 4
Download original image
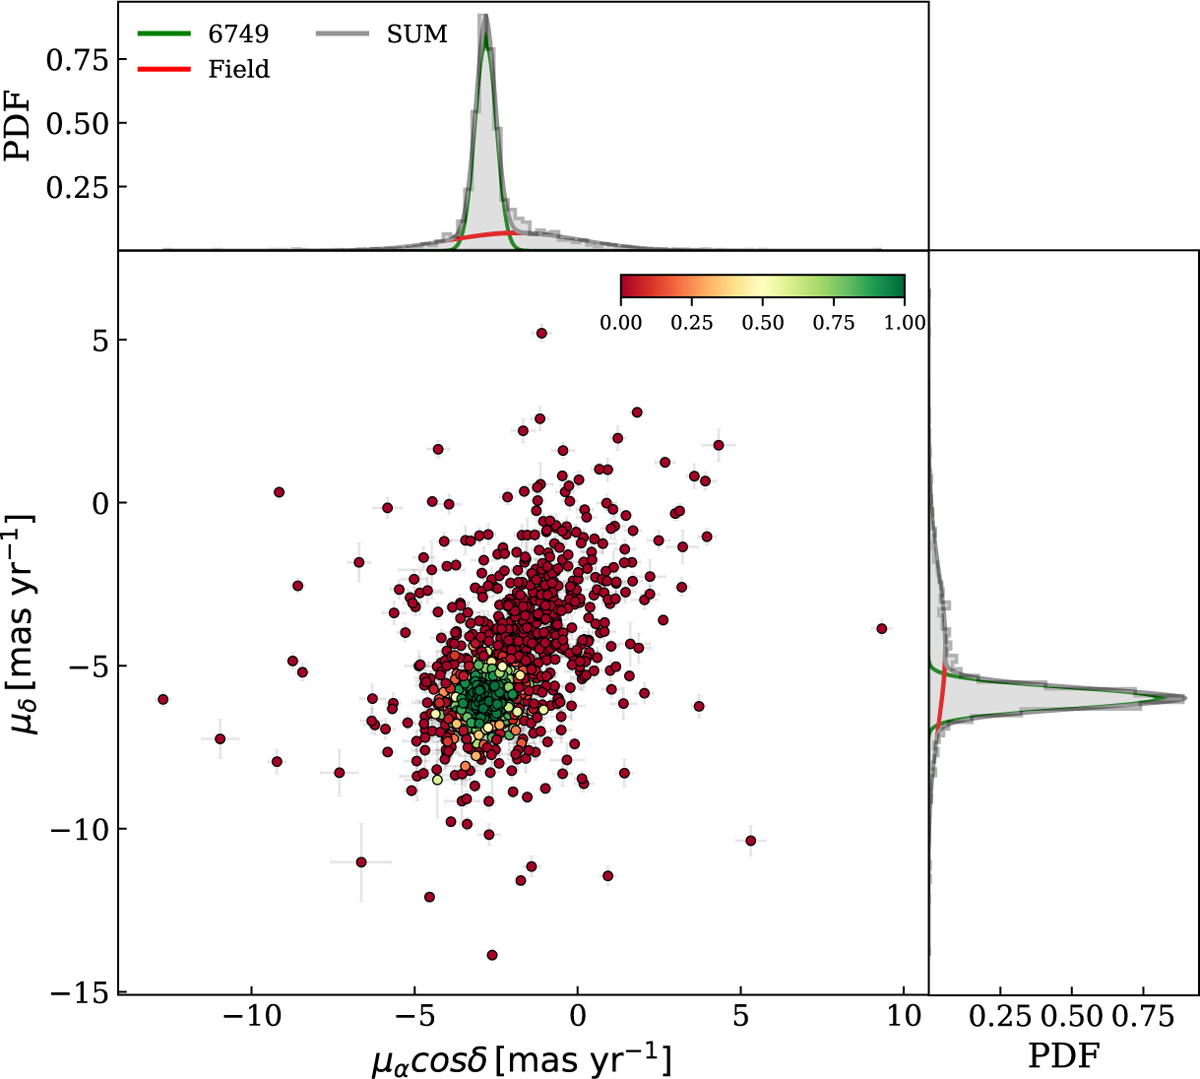
Distribution of the NGC 6749 GH PMs. The central scatter plot shows the 2D VPD, where the points are color-coded by the membership probability obtained from the MCMC chains (color bar). The top and right histograms show the normalized marginal distributions of the PMs, together with the posterior distributions of the GMM components, the target in red, the field in blue, and their sum in gray.
Current usage metrics show cumulative count of Article Views (full-text article views including HTML views, PDF and ePub downloads, according to the available data) and Abstracts Views on Vision4Press platform.
Data correspond to usage on the plateform after 2015. The current usage metrics is available 48-96 hours after online publication and is updated daily on week days.
Initial download of the metrics may take a while.