Fig. 1.
Download original image
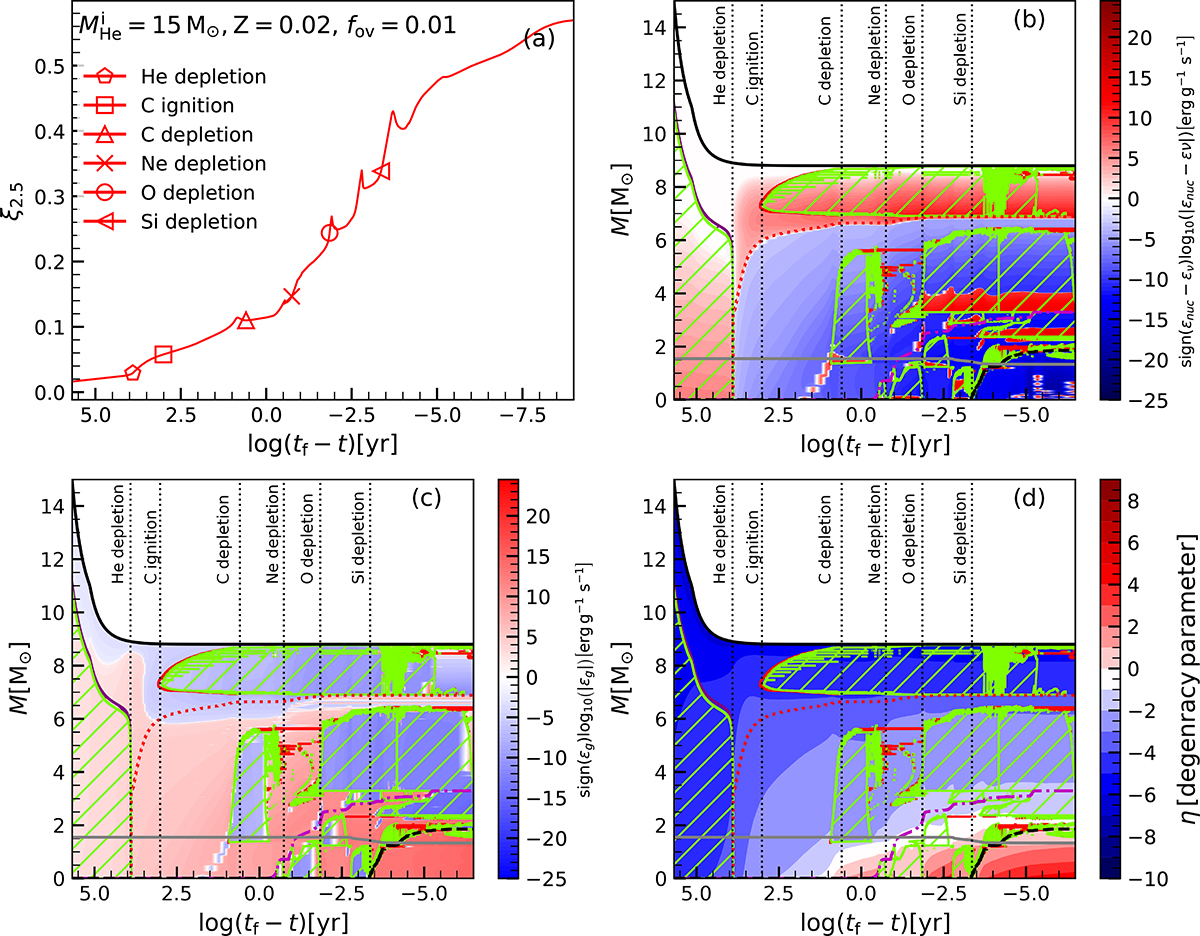
Evolutionary track of a 15 M⊙ He star with solar metallicity (Z = 0.02) and overshooting parameter fov = 0.01. Panel (a): temporal evolution of the compactness parameter ξ2.5 until seconds before core collapse. Key evolutionary phases are marked as follows: pentagram (central He depletion), square (central C ignition), triangle (central C depletion), cross (central Ne depletion), open circle (central O depletion), and left-pointing triangle (central Si depletion). Panel (b): Kippenhahn diagram from core He-burning to the onset of core collapse. The color bar shows the nuclear energy generation rate (ϵnuc, red) and neutrino loss rate (ϵν, blue). The green, purple, and red-hatched regions represent the convective, overshooting, and semiconvective mixing regions, respectively. The gray solid indicate the classical Chandrasekhar mass, MCh, 0, as defined in Eq. (6). The dashed black, dotted red, and dash-dotted magenta lines denote the iron, He-free (MHe-free), and C-free (MC-free) cores, respectively. Vertical dotted lines mark specific depletion and ignition events. Panel (c): same as panel (b), but the color represents the specific gravothermal energy, ϵgrav ≡ −Tds/dt (red: contraction , blue: expansion). Panel (d): same as panel (b), but the color represents the electron degeneracy parameter, η ≡ μ/kBT, where μ is the chemical potential, kB is the Boltzmann constant, and T is temperature. η ≪ −1: non-degenerate; η ≈ 0: partial degeneracy; η ≫ 1: strong degeneracy.
Current usage metrics show cumulative count of Article Views (full-text article views including HTML views, PDF and ePub downloads, according to the available data) and Abstracts Views on Vision4Press platform.
Data correspond to usage on the plateform after 2015. The current usage metrics is available 48-96 hours after online publication and is updated daily on week days.
Initial download of the metrics may take a while.