| Issue |
A&A
Volume 707, March 2026
|
|
|---|---|---|
| Article Number | A390 | |
| Number of page(s) | 16 | |
| Section | Stellar structure and evolution | |
| DOI | https://doi.org/10.1051/0004-6361/202558335 | |
| Published online | 20 March 2026 | |
Formation of black holes from He stars
1
Yunnan Observatories, Chinese Academy of Sciences, Kunming, 650216, China
2
University of Chinese Academy of Sciences, Beijing, 100049, China
3
International Centre of Supernovae (ICESUN), Yunnan Key Laboratory, Kunming, 650216, China
4
London Centre for Stellar Astrophysics, Vauxhall, London, United Kingdom
5
University of Oxford, St Edmund Hall, Oxford, OX1 4AR, United Kingdom
6
School of Astronomy and Space Science, Nanjing University, Nanjing, 210023, China
7
College of Physics, Guizhou University, Guiyang, 550025, China
⋆ Corresponding author: This email address is being protected from spambots. You need JavaScript enabled to view it.
Received:
1
December
2025
Accepted:
13
February
2026
Abstract
Massive He stars are potential candidates of type Ib/c supernova (SN) progenitors. Understanding their final fates remains a key issue in astrophysics. In this work, we investigate the evolution of He stars with initial masses from 5 M⊙ to 65 M⊙, focusing on the presupernova (pre-SN) core structures to assess their explodability. Our simulations indicate that the final core structure is determined by the CO core mass and the central 12C mass fraction at the end of core He burning, affecting the properties of central C-burning and the locations of convective shells. The location of the last convective C-burning shell sets the mass of the C-free core, constraining the iron core mass and compactness. We found that the final compactness and iron core mass exhibit non-monotonic behavior with initial mass, suggesting that the boundary between neutron star and black hole formation is not a simple mass threshold. This is due to core C/Ne burning becoming neutrino dominated. This process drives stronger core contraction, ultimately increasing the iron core mass and the final compactness. In contrast, earlier core Ne/O/Si ignition and shell mergers inhibit core contraction, reducing both the iron core mass and final compactness. We also discuss the effects of metallicity and overshooting on the pre-SN core structure. These factors potentially affect the explodability of progenitors.
Key words: stars: black holes / stars: evolution / stars: interiors / stars: massive / stars: Wolf-Rayet
© The Authors 2026
 Open Access article, published by EDP Sciences, under the terms of the Creative Commons Attribution License (https://creativecommons.org/licenses/by/4.0), which permits unrestricted use, distribution, and reproduction in any medium, provided the original work is properly cited.
This article is published in open access under the Subscribe to Open model. This email address is being protected from spambots. You need JavaScript enabled to view it. to support open access publication.
1. Introduction
Most massive stars reside in close binaries and interact with companion stars during their lifetimes, and these interactions have a significant impact on both their evolution and core structures (Sana et al. 2012; Langer 2012; Moe & Di Stefano 2017; Laplace et al. 2021; Marchant & Bodensteiner 2024; Chen et al. 2024). Binary interactions are expected to strip the hydrogen-rich envelopes to varying degrees, leaving behind a stripped-envelope star, such as a Wolf-Rayet star or a He star (Podsiadlowski et al. 1992; Pols & Dewi 2002; Langer 2012; Yoon et al. 2010; Song et al. 2016; Laplace et al. 2020; Klencki et al. 2022). These stars are potential candidates for progenitors of type Ib/Ic supernovae (SNe) (Crowther 2007; McClelland & Eldridge 2016; Yoon 2017). Thus, He stars are widely used as proxy models to study the evolution of stripped-envelope stars (e.g., Brown et al. 2001; Pols & Dewi 2002; Yoon et al. 2012; Yoon 2017; Woosley 2019; Ertl et al. 2020; Dessart et al. 2020; Aguilera-Dena et al. 2022, 2023; Wang et al. 2026). However, it remains uncertain which He stars successfully explode and which ones fail. Understanding their final fates remains a key issue in gravitational-wave astronomy.
The final fates of massive stars depend on their presupernova (pre-SN) core structure, which is associated with the properties of the subsequent neutrino-driven core-collapse SN (CCSN) explosion (e.g., O’Connor & Ott 2011; Fryer et al. 2012; Ugliano et al. 2012; Foglizzo et al. 2015; Müller et al. 2016; Sukhbold et al. 2016; Ertl et al. 2016; Couch et al. 2020; Burrows & Vartanyan 2021; Schneider et al. 2021; Takahashi et al. 2023; Zha et al. 2023; Laplace et al. 2025). In this work, we focus on the pre-SN core structure to predict the explodability of progenitors, i.e., whether a star successfully explodes. A common method uses the compactness parameter ξ2.5 to characterize the core structure and assess the explodability (O’Connor & Ott 2011). Higher values indicate a more compact core, suggesting that it is more likely to undergo a failed explosion and result in a (black hole) BH remnant (O’Connor & Ott 2011; Ugliano et al. 2012; Sukhbold & Woosley 2014; Chieffi & Limongi 2020; Schneider et al. 2021; Temaj et al. 2024; Laplace et al. 2025). Another explodability criterion is based on the parameters M4 and μ4, where M4 typically corresponds to the Si/O shell interface and μ4 characterizes the density of the oxygen shell (Ertl et al. 2016, 2020; Sukhbold et al. 2016; Müller et al. 2016; Wang et al. 2022b; Boccioli et al. 2023; Heger et al. 2024).
All of these explodability criteria have indicated that the explodability of stars exhibits non-monotonic behavior with initial mass, characterized by islands of explodability (e.g., O’Connor & Ott 2011; Ertl et al. 2016, 2020; Sukhbold et al. 2016, 2018; Chieffi & Limongi 2020; Patton & Sukhbold 2020; Schneider et al. 2021; Laplace et al. 2025; Maltsev et al. 2025). Several studies have investigated the physical mechanisms behind this behavior. For instance, the non-monotonic behavior of the final ξ2.5 parameter with initial mass is influenced by the interaction between multiple C- and O-burning shells (Sukhbold & Woosley 2014; Chieffi & Limongi 2020). Patton & Sukhbold (2020) and Schneider et al. (2021) demonstrated that variations in the final compactness are correlated with the carbon-oxygen (CO) core mass and the residual 12C mass fraction at the end of core He burning. When neutrino energy loss exceeds the energy released by core C/Ne burning, stars experience a transition of core C/Ne burning from the convective to radiative regime, which is correlated with an increase in final compactness (Sukhbold & Woosley 2014; Sukhbold & Adams 2020; Chieffi & Limongi 2020; Schneider et al. 2021; Laplace et al. 2025). However, this non-monotonic behavior and the final fates of massive stars are highly sensitive to various uncertainties in their evolution, such as mass loss rates, metallicity, overshooting, and nuclear reaction rates, among others (e.g., Smith 2014; Sukhbold & Woosley 2014; Renzo et al. 2017; Chieffi et al. 2021; Aguilera-Dena et al. 2023; Temaj et al. 2024).
In this work, we investigate the evolution of He stars and predict their final fates based on the pre-SN core structures. The paper is organized as follows. In Section 2, we describe the methods and physical assumptions in our numerical simulations. Section 3 presents the evolution and calculated results, followed by the discussion in Section 4 and the conclusions in Section 5.
2. Methods and assumptions
We investigated the evolution of He stars using the MESA code (r10398; Paxton et al. 2011, 2013, 2015; Paxton et al. 2018, 2019) from the zero-age helium main sequence (ZaHeMS) to the onset of core collapse, which is defined as the point where the infall velocity at the iron core boundary reaches 1000 km s−1. We constructed a grid of He star models following Aguilera-Dena et al. (2022), with initial masses from 5 M⊙ to 65 M⊙, using mass increments of ΔM = 1 M⊙ for 5–30 M⊙ and ΔM = 5 M⊙ for 30–65 M⊙. The models were computed with an initial metallicity of Z = 0.02 and the approx21_cr60_plus_co56.net nuclear reaction network, adopting the 12C(α, γ)16O reaction rate from Angulo et al. (1999). The 12C(α, γ)16O reaction is one of the most important reactions in the evolution of massive stars, yet its rate is still highly uncertain (e.g., Sukhbold & Woosley 2014; deBoer et al. 2017). Long et al. (2026) suggest that different rates for this reaction significantly affect the pre-SN core structure and explodability of He stars.
Convection was treated using the mixing length theory with a mixing length parameter αMLT = 2.0 (Böhm-Vitense 1958). We applied the Ledoux criterion for convective boundaries and included semi-convective mixing with an efficiency parameter αSEM = 1.0. During core He burning, we also included exponential overshooting with a parameter fov = 0.01 (e.g., Herwig 2000; Marchant et al. 2019; Renzo et al. 2020). Additionally, we computed the models using the spatial and temporal resolution of MESA with mesh_delta_coeff = 0.6 and varcontrol_target =10−5.
2.1. Stellar wind mass loss
To calculate the mass loss rate of He stars, we followed the prescription of Yoon (2017), who systematically studied the mass loss rates for all subtypes of Wolf-Rayet (WR) stars (WNE, WC, and WO). These prescriptions are based on the work of Tramper et al. (2016) for WC and WO stars and Hainich et al. (2014) for WNE stars. The mass loss rates were calculated as follows. For WC/WO stars with a surface He mass fraction YS ≤ 0.9,
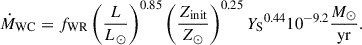 (1)
(1)
For WNE stars with YS > 0.98,
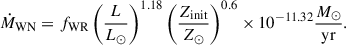 (2)
(2)
For 0.9 < YS < 0.98, the mass loss rate we used is as follows,
 (3)
(3)
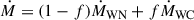
with f = (1−Zinit−Y)/(1−Zinit−0.9). We adopted the standard scaling factor fWR = 1.0 and solar metallicity Z⊙ = 0.02.
2.2. Explodability criterion
The compactness parameter is often used as a criterion to characterize the core structure and assess the explodability of progenitors. It is defined by O’Connor & Ott (2011) as
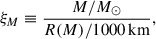 (4)
(4)
where M is typically evaluated at a mass coordinate of M = 2.5 M⊙, and R(M) is the corresponding radius. For progenitors with ξ2.5 ≲ 0.45, they are more likely to explode successfully, resulting in neutron stars (NSs), whereas at higher compactness values, they are more likely to collapse into BHs (O’Connor & Ott 2011). While Ugliano et al. (2012) suggested that BHs may originate from progenitors with ξ2.5 ≳ 0.35, those with ξ2.5 ≲ 0.15 are more likely to produce NSs.
However, the compactness parameter does not seem to be a reliable predictor of explodability, as both high- and low-compactness models can explode (e.g., Ertl et al. 2016; Müller et al. 2016; Burrows & Vartanyan 2021; Wang et al. 2022b; Zha et al. 2023; Takahashi et al. 2023; Burrows et al. 2020, 2023). In order to estimate the fate after core collapse, we used the semi-analytic SN code of Müller et al. (2016) to obtain the properties of successful neutrino-driven CCSN explosion, such as the explosion energy and the compact remnant mass. We adopted a maximum gravitational NS mass of 2 M⊙, assuming a direct collapse into a BH for models with remnant masses exceeding this value (see also Müller et al. 2016; Schneider et al. 2021, 2024; Temaj et al. 2024). For comparison, we also used the two-parameter criterion to judge the explodability, which was proposed by Ertl et al. (2016). Their criterion is based on M4, the mass coordinate at which the specific entropy per nucleon equals four (typically corresponding to the Si/O interface), and μ4, the density gradient at that mass coordinate,
 (5)
(5)
The μ4 and M4μ4 are loosely correlated with the accretion rate and the accretion luminosity after the infall of the Si/O shell interface (Müller et al. 2016; Ertl et al. 2016, 2020). We used the relation μ4 = 0.294μ4M4 + 0.0468 from the updated calibration model S19.8 to distinguish between explosion and non-explosion models (see Ertl et al. 2020 for details).
3. Results
We investigated the evolution of the compactness parameter ξ2.5 as a function of time until core collapse for a representative model. The pre-collapse structural properties of all models were subsequently characterized, from which their final fates were predicted. Finally, we explored the impact of metallicity and overshooting on the pre-SN core structure. Tables A.1–1 list the initial model configurations used in this work along with a summary of the properties at the onset of core collapse.
Dependence of pre-SN properties on physical parameters.
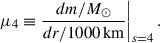
3.1. A representative example
Fig. 1 shows the evolution of the ξ2.5 parameter (panel a) and the stellar structure (panels b–d) of a 15 M⊙ He star with Z = 0.02 and fov = 0.01 from the ZaHeMS to the onset of core collapse. In this figure, key evolutionary phases are marked based on specific thresholds: Central C ignition corresponds to Tc ≥ 8 × 10⁸ K, while the depletion of fuel (4He, 12C, 20Ne, 16O, and 28Si) is defined as the point when the central mass fraction drops below 10−4. The evolution of ξ2.5 with stellar age is governed by the complex interplay between the various convective shells (i.e., C, Ne, and O shells) and the effects of electron degeneracy pressure (Sukhbold & Woosley 2014; Renzo et al. 2017; Chieffi & Limongi 2020). As shown in Fig. 1a, during core He burning, ξ2.5 gradually increases because the convective He-burning core contracts overall. This contraction is displayed in Fig. 1c by the specific gravothermal energy, defined as ϵgrav ≡ −Tds/dt, where T is the temperature and ds/dt is the time derivative of specific entropy; red regions indicate contraction, while blue regions indicate expansion. At the end of core He burning, the values of MCO and XC are 7.51 M⊙ and 0.254, respectively (see Table A.1). Following core He depletion, ξ2.5 continues to increase until central C depletion, as central C-burning proceeds radiatively (Fig. 1b). This radiative process is driven by the reduction in XC, which lowers the nuclear energy generation rate below the neutrino energy loss rate. After central C depletion, the significant decrease in the energy production rate induces contraction of both the core and the shells, which persists until the temperature is high enough to ignite shell C burning. The C-burning front also moves outward in mass from the center (see Fig. 1b). Notably, the burning front corresponds to the mass coordinate of the peak energy generation rate (indicated by the red regions in Fig. 1b), which also represents the base of the convective burning zone. The location of the burning front reflects the degree of core contraction that occurred beneath it (Laplace et al. 2025). During the first convective C-burning shell (between core C depletion and Ne ignition), the ξ2.5 value remains nearly constant (see Fig. 1a). This is because the C-burning front resides near, but below, MCh, 0, with electron degeneracy pressure effectively resisting further core contraction (see Fig. 1d). To illustrate the degree of degeneracy, Fig. 1d presents the electron degeneracy parameter, η ≡ μ/kBT, where μ is the chemical potential, kB is Boltzmann constant, and T is temperature, distinguishing between regimes of non-degeneracy (η ≪ −1), partial degeneracy (η ≈ 0), and strong degeneracy (η ≫ 1).
 |
Fig. 1. Evolutionary track of a 15 M⊙ He star with solar metallicity (Z = 0.02) and overshooting parameter fov = 0.01. Panel (a): temporal evolution of the compactness parameter ξ2.5 until seconds before core collapse. Key evolutionary phases are marked as follows: pentagram (central He depletion), square (central C ignition), triangle (central C depletion), cross (central Ne depletion), open circle (central O depletion), and left-pointing triangle (central Si depletion). Panel (b): Kippenhahn diagram from core He-burning to the onset of core collapse. The color bar shows the nuclear energy generation rate (ϵnuc, red) and neutrino loss rate (ϵν, blue). The green, purple, and red-hatched regions represent the convective, overshooting, and semiconvective mixing regions, respectively. The gray solid indicate the classical Chandrasekhar mass, MCh, 0, as defined in Eq. (6). The dashed black, dotted red, and dash-dotted magenta lines denote the iron, He-free (MHe-free), and C-free (MC-free) cores, respectively. Vertical dotted lines mark specific depletion and ignition events. Panel (c): same as panel (b), but the color represents the specific gravothermal energy, ϵgrav ≡ −Tds/dt (red: contraction , blue: expansion). Panel (d): same as panel (b), but the color represents the electron degeneracy parameter, η ≡ μ/kBT, where μ is the chemical potential, kB is the Boltzmann constant, and T is temperature. η ≪ −1: non-degenerate; η ≈ 0: partial degeneracy; η ≫ 1: strong degeneracy. |
Following the onset of core Ne burning, the growth rate of ξ2.5 increases substantially. Notably, the evolution of ξ2.5 exhibits distinct oscillations after the end of core O burning (see the open circle in Fig. 1a). These oscillations are driven by variations in the Si- and O-burning shells (Renzo et al. 2017). For example, as shown in Fig. 1b, the first O-burning convective shell (ignited at log(tf − t)≈ − 2 yr) is located within the mass coordinate used to evaluate the compactness. This shell releases a significant amount of energy, causing the outer layers to expand (see Fig. 1c), which in turn reduces ξ2.5. The compactness parameter ξ2.5 ultimately reaches a value of 0.571. The final mass of the C-free core is 3.28 M⊙, which sets an upper limit on the growth of the Si-rich core and thus constrains the final iron core mass to 1.85 M⊙ (e.g., Brown et al. 2001; Schneider et al. 2021; Laplace et al. 2025). As Fryer et al. (2002) suggested, the edge of the C-burning shell marks the boundary of the C-free core, and we defined the He-free and C-free core boundaries as the mass coordinates where XHe < 10−5 and XC < 10−5, respectively (see also Schneider et al. 2021).
Fig. 2 presents the core structure of the progenitor at the onset of core collapse. Fig. 2a shows the infall velocity profile and the mass fraction profiles of 56Fe, 28Si, and 16O as a function of mass coordinate for the representative model at the onset of core collapse. These abundance curves depict the iron core boundary and the Si/O shell interface. As illustrated in Fig. 2b, the central density profile exhibits no significant discontinuity at the Si/O shell interface (see the dash-dotted blue line in Fig. 2b) at the onset of core collapse, suggesting a low likelihood of a successful explosion (Wang et al. 2022b; Boccioli et al. 2023). For M4 = 2.32 and μ4 = 0.16 (see Fig. 2b), the criterion of Ertl et al. (2016) predicts no explosion. Similarly, the semianalytic approach of Müller et al. (2016) also predicts that the star fails to explode, resulting in a gravitational remnant mass of 8.79 M⊙.
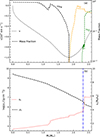 |
Fig. 2. Same model as Fig. 1. The figure shows the core structure of the progenitor at the onset of core collapse. Panel (a): radial infall velocity (black dotted line, left axis) and mass fraction profiles of 56Fe, 28Si, and 16O (dashed lines, right axis) versus the mass coordinate Mr. Panel (b): radial profiles of the central density (dashed line) and specific entropy (dotted line) as functions of the mass coordinate Mr, where the iron core mass is 1.85 M⊙. The dash-dotted blue line marks the mass coordinate where the central specific entropy sc = 4 kB, corresponding to the Si/O shell interface at Mr = 2.32 M⊙. |
3.2. Pre-collapse structural characteristics of He stars
To characterize the pre-SN core structure and assess the explodability of stars, we focus on five key quantities at the onset of core collapse, including the compactness parameter ξ2.5, central specific entropy sc, iron core mass MFe, C-free core mass MC-free, and the binding energy above the iron core Ebind. Fig. 3 shows these quantities as functions of initial mass, revealing consistent non-monotonic trends. These trends reflect the core’s structural properties, as demonstrated in previous studies (e.g., O’Connor & Ott 2011; Ertl et al. 2016; Schneider et al. 2021, 2024; Takahashi et al. 2023; Temaj et al. 2024; Laplace et al. 2025). Specifically, the final central entropy and the final iron core mass both follow trends similar to the final compactness parameter as a function of the initial mass. The relationship between the final central entropy (Fig. 3b) and the final iron core mass (Fig. 3c) can be interpreted in terms of the effective Chandrasekhar mass MCh (Timmes et al. 1996; Woosley et al. 2002; Sukhbold & Woosley 2014; Schneider et al. 2024; Laplace et al. 2025). The effective Chandrasekhar mass, MCh, is given by Suwa et al. (2018):
![Mathematical equation: $$ \begin{aligned} M_{\mathrm{Ch}}\approx M_{\rm Ch,0}\left[1+\left(\frac{s_{\mathrm{e}, \mathrm{c}}}{\pi Y_{\mathrm{e}, \mathrm{c}}}\right)^2\right], \end{aligned} $$](/articles/aa/full_html/2026/03/aa58335-25/aa58335-25-eq8.gif) (6)
(6)
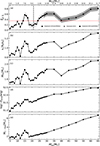 |
Fig. 3. Key parameters at the onset of core collapse. Panel (a): final compactness parameter ξ2.5. Panel (b): central specific entropy sc. Panel (c): iron core mass MFe. Panel (d): binding energy above the iron core Ebind. Panel (e): C-free core mass MC-free, all plotted as functions of the initial helium star mass |


where  , Ye, c is the central value of the electron fraction Ye, and se, c is the central value of the electronic entropy per baryon se, which is approximately one-third of the average central specific entropy sc (Baron & Cooperstein 1990; Timmes et al. 1996). When the iron core reaches the Chandrasekhar mass MCh, core collapse is triggered. However, MCh is sensitive to variations in sc and Ye, c (see Eq. 6), with the latter remaining nearly constant across different progenitors (Sukhbold & Woosley 2014). Thus, MFe is closely correlated with sc at the time of core collapse.
Furthermore, the final iron core is in an adiabatic state, with its entropy (Fig. 3b) following the polynomial relation sc ∝ lnK ∝ 2lnM + lnR (Schneider et al. 2021). This correlation further elucidates the connection between sc and the mass-radius relation of the core, as reflected in the relationship between sc and ξ2.5 (Fig. 3a). Additionally, we find that within the initial mass range of 5 − 30 M⊙, both Ebind and MC-free follow non-monotonic trends, similar to those of ξ2.5, sc, and MFe. The iron core mass is constrained by the C-free core within this range (Brown et al. 2001; Schneider et al. 2021; Laplace et al. 2025). Beyond this range, both Ebind and MC-free increase approximately linearly.
Fig. 4 displays the central density, ρc, CO core mass, MCO, and central 12C mass fraction, XC, at the end of core He burning for all models. Obviously, higher-mass He stars exhibit lower central densities, despite having a higher CO core mass (Fig. 4a). According to deBoer et al. (2017), the molar abundance Y(12C) depends on the molar abundance of 4He, the central density ρc, and the corresponding reaction rates λ3α and  , as shown in the rate equation
 |
Fig. 4. Core properties at the end of core He burning as a function of initial mass. Panel (a): central density ρc and CO core mass MCO at the end of core He burning, shown as a function of the initial He star mass |


 (7)
(7)
This equation indicates that carbon production is favored at high densities. Therefore, higher-mass He stars exhibit lower central 12C mass fractions (see Fig. 4b). At the end of core He burning, XC and MCO set the initial conditions for the subsequent burning stages, which have important consequences for the final core structure (e.g., Sukhbold & Woosley 2014; Chieffi & Limongi 2020; Sukhbold & Adams 2020; Patton & Sukhbold 2020; Schneider et al. 2021; Laplace et al. 2025). Specifically, when the energy generation rate ϵnuc ∼ XC2ρT23 (where ρ and T are density and temperature near the center) exceeds the neutrino cooling rate ϵν ∼ T12ρ−1, the burning mode becomes convective (Sukhbold & Adams 2020). As shown in Fig. 4b, when the value of XC drops below approximately 0.266, core C burning phase transitions from convective to radiative. Similarly, when XC falls below 0.202, core Ne burning phase also shifts to radiative. These transitions correspond to the gray and dark shaded regions in Fig. 3a. To understand these non-monotonic trends, we investigated the key mechanisms that shape the final compactness and core structure, which are analyzed in detail below. As shown in Fig. 5, the Kippenhahn diagrams illustrate the evolution from core C burning to the onset of core collapse.
 |
Fig. 5. Same as Fig. 1b, but for models with |

3.2.1. Increase in final compactness: Core C-burning transition stage
For the models with  , the final compactness ξ2.5 increases with mass (Fig. 3a), peaking at ξ2.5 = 0.571 for
  . This trend is driven by the decrease in central density and carbon abundances with increasing initial mass (Fig. 4), which triggers the transition from convective to radiative core C burning. Fig. 5 shows the Kippenhahn diagrams that compare the evolution of the 12 M⊙, 13 M⊙, and 15 M⊙ models.
The 12 M⊙ model exhibits a tiny convective C-burning core, while the 13 M⊙ and 15 M⊙ models exhibit radiative C-burning cores. This transition indicates that core C burning becomes neutrino-dominated, triggers stronger core contraction, and drives the outward progression of the C-burning front. After the convective or radiative C-burning core exhausts its fuel, the subsequent core contraction triggers the formation of the first convective C-burning shell. The C-burning front reaches the base of this shell at mass coordinates of 0.82 M⊙, 1.03 M⊙, and 1.37 M⊙ for the 12 M⊙, 13 M⊙, and 15 M⊙ models, respectively. As these C-burning fronts move further out in mass, it indicates stronger core contraction (Laplace et al. 2025). For example, the  model shows a more extended region of electron degeneracy compared to the other two models during the first convective C-burning shell (see Fig. D.1). Since the C-burning front in these models remains below MCh, 0 (see the gray solid lines in Fig. 5), electron degeneracy pressure counteracts core contraction, thereby delaying the ignition of Ne- and O- burning (Sukhbold & Woosley 2014; Laplace et al. 2025). In the 15 M⊙ model, core Ne- and O-burning ignite sequentially after the first C-burning shell depletes its fuel, further delaying the outward progression of the C-burning front until O-burning ends. Subsequent core contraction triggers a second convective C-burning shell. The C-burning front moves out to a mass coordinate of 3.28 M⊙ and remains there until the end of evolution, ultimately producing a large C-free core of 3.28 M⊙ (indicated by the dash-dotted magenta line in Fig. 5). This results in a 1.88 M⊙ iron core and a compactness value of 0.57.
In the 12 M⊙ and 13 M⊙ models, the second convective C-burning shell is triggered immediately after core C depletion (see the first dashed line in the top row of Fig. 5) and remains at the same mass coordinate until collapse, which yields smaller C-free cores of 1.86 M⊙ and 2.20 M⊙, respectively. This suppresses Si-rich core growth, leading to smaller iron cores and reduced compactness.
3.2.2. Decrease in final compactness: Convective shell merger stage
For the models with  , the final compactness gradually decreases (see Fig. 3a). This trend is primarily driven by earlier core Ne and O ignition as well as shell mergers. As shown in Fig. 5, central C-burning in these models proceeds radiatively and is dominated by neutrino losses. After core C depletion (see the first dashed line in Fig. 5), the first convective C-burning shell forms, and the C-burning front gradually shifts outward in mass coordinate. For example, the front extends to approximately 1.37 M⊙ in the 15 M⊙ model, compared to 1.81 M⊙ in the 18 M⊙ model. The C-burning front approaches or exceeds MCh, 0 during the first convective C-burning shell. This triggers a rapid contraction of the partially degenerate core, accelerating the earlier ignition of Ne burning before the first covective C-burning shell is fully depleted (Laplace et al. 2025). The earlier ignition of core Ne and O enhances core luminosity, suppress core contraction, and slows the progression of the C-burning front. After core O depletion (see the third dashed line in Fig. 5), further core contraction ignites the second C-burning convective shell, shifting the location of the C-burning front to 3.28 M⊙, 3.27 M⊙, 2.87 M⊙, and 2.80 M⊙ for the 15 M⊙, 16 M⊙, 17 M⊙, and 18 M⊙ models, respectively.
After core Si burning (see the last dashed line in Fig. 5), the mass coordinate of the C-burning front in the 15 M⊙ model remains constant at 3.28 M⊙. However, for models with  , its mass coordinate declines to varying degrees. This behavior is attributed to a substantial increase in both the nuclear energy generation and the entropy within the Ne/O-burning shells. When the entropy of these shells exceeds that of the C-burning shell above, a shell merger is triggered. Following the merger, the burning front moves to a lower mass coordinate and forms a larger convective shell, causing the overlying layers to expand (Sukhbold & Woosley 2014; Sukhbold et al. 2018; Collins et al. 2018; Davis et al. 2019; Laplace et al. 2025). In the 16 M⊙ and 17 M⊙ models, a merger of the Ne shell with the C shell above occurs after core Si ignition. The burning front then moves inward to mass coordinates of 2.84 M⊙ (at log(tf − t)≈ − 3.4 yr) and 2.72 M⊙ (at log(tf − t)≈ − 3.57 yr), respectively, which are consistent with the masses of their C-free cores. In the 18 M⊙ model, in addition to experiencing the merger of the Ne and C shells, the O shell also merges with the Ne and C shells above. This process causes the mass coordinate of the burning front to decrease to 1.83 M⊙, corresponding to the mass of a C-free core (see the magenta dashed line in Fig. 5), which leads to a smaller iron core and a corresponding reduction in ξ2.5.
3.2.3. Reincrease in final compactness: Core Ne-burning transition stage
For the models with  , the final compactness gradually increases again, reaching a second peak of 0.60 at
  , which corresponds to MCO ≈ 13.98 M⊙ (see also Fig. 3a). With increasing initial mass, both the residual C mass fraction after central He burning depletion and the Ne mass fraction generated via the 12C(12C,α)20Ne reaction decrease. This drives a transition in the nature of core Ne burning, as well as in the number and size of Ne-burning shells (e.g., from multiple small zones to a few tiny ones, eventually transitioning to a fully radiative core Ne burning, see in the 23 M⊙, 26 M⊙, and 29 M⊙ models in Fig. 5).
As neutrino losses increase and the core contracts further, radiative Ne burning cannot effectively suppress the progression of the C-burning front. Furthermore, the increase in entropy from the Ne-burning shell is insufficient to trigger a merger with the C-burning shell above. Thus, the C-burning front continues to move outward in mass coordinates until it ignites a convective C-burning shell, maintaining this state until the onset of core collapse. In the 23 M⊙, 26 M⊙, and 29 M⊙ models, the C-burning front reaches 2.29 M⊙, 2.57 M⊙, and 2.83 M⊙, respectively. Since the mass coordinate of the C-burning front in the 26 M⊙ and 29 M⊙ models exceeds the mass coordinate used for the compactness parameter, this leads to a gradual increase in their final compactness. Additionally, the C-free core nearly reaches the C-burning front in the 23 M⊙ and 26 M⊙ models, while in the 29 M⊙ model, it reaches 2.70 M⊙, slightly below the corresponding C-burning front. These differences in the location of the C-burning front and the C-free core ultimately lead to a systematic increase in both the iron core mass and final compactness (e.g., in the 23 M⊙, 26 M⊙, and 29 M⊙ models, the iron core masses are 1.62 M⊙, 1.77 M⊙, and 1.83 M⊙, with corresponding final compactness values of 0.220, 0.477, and 0.580, respectively).
3.2.4. Subsequent decrease in final compactness: Core O- and Si-burning dominance stage
For the models with  , the final compactness decreases gradually once again (see also Fig. 3a). In these models, both C and Ne burn radiatively in the center (see Fig. 5). Notably, the location of their last C-burning convective shell significantly exceeds the mass coordinate used for the compactness parameter, thereby reducing the constraints on the final iron core mass and compactness. Consequently, the core O and Si burning, along with their convective shells, become progressively more important for the subsequent evolution.
In the 30 M⊙ model, the mass coordinate at the base of the first convective O-burning shell is close to MCh, 0 (see Fig. 5). However, in the 35 M⊙ and 40 M⊙ models, it exceeds both MCh, 0 and MCh, which accelerates core contraction and triggers early Si burning. As shown in Fig. 5, core Si ignition occurs before the depletion of the first convective O-burning shell in the 35 M⊙ and 40 M⊙ models. Additionally, in the 40 M⊙ model, a larger convective shell forms and persists until the end of evolution. This delays the progression of the O-burning front in mass coordinate (e.g., the O-burning front reaches 2.22 M⊙, 2.30 M⊙, and 1.82 M⊙ in the 30 M⊙, 35 M⊙, and 40 M⊙ models, respectively). Consequently, this results in the formation of iron cores with smaller masses and reduced compactness.
3.3. Final fates and compact-remnant masses
We used the semianalytic approach of Müller et al. (2016) and the criterion of Ertl et al. (2016) to estimate the final fate after core collapse. As shown in Fig. 3a, using these methods, He stars with initial masses  (MCO ≤ 7.27 M⊙) are predicted to explode, except for the model with
  (MCO = 5.25 M⊙), which is predicted to explode according to the criterion of Ertl et al. (2016), but not according to Müller et al. (2016). At higher masses, the
  star is predicted to explode according to Ertl et al. (2016) but collapse following Müller et al. (2016). Both methods consistently predict that stars with
  (MCO ≥ 11.19 M⊙) will fail to explode and instead directly collapse to form BHs. Although the compactness parameter alone is insufficient to determine whether a star will undergo a successful neutrino-driven SN explosion (e.g., Wang et al. 2022b; Burrows et al. 2023), our analysis suggests that for models with ξ2.5 > 0.35, both the semianalytic approach of Müller et al. (2016) and the criterion of Ertl et al. (2016) predict that the star will fail to explode and is more likely to collapse into a BH remnant. This is illustrated in Fig. 3a, where the red dashed line at ξ2.5 = 0.35 separates models that may explode (below the line) from those that are more likely to collapse into a BH (above the line).
Fig. 6 shows the core-collapse outcomes for all models using semianalytic approach of Müller et al. (2016), presenting the mass distributions of compact remnants as functions of  and MCO. The remnant mass distribution exhibits a non-monotonic trend with both
  and MCO, similar to the behavior of the compactness parameter. This mapping is consistent with Patton et al. (2022), who predicted alternating regions of successful explosion and implosion based on the pre-SN core structure, rather than a continuous distribution. For instance, Patton et al. (2022) identified a prominent peak in the BH mass function around ∼10 M⊙ followed by a frequency drop above ∼11.5 M⊙. Physically, this mapping corresponds to the correlation we observed in Fig. 3 between BH formation and models with high final compactness, which are characterized by elevated binding energy, iron-core mass, carbon-free core, and central entropy. As noted by Schneider et al. (2021), all these key quantities exhibit non-monotonic behavior with MCO, which determines the pattern of NS and BH formation. Specifically, Schneider et al. (2021) found that Case A and B stripped stars have higher XC than single and Case C stripped stars at the same MCO. This difference alters the transition from convective to radiative core C/Ne burning, leading to a systematic shift of the island of explodability in MCO (e.g., the first compactness peak shifts from ∼7 M⊙ for single and Case C stripped stars to ∼8 M⊙ for Case A and B stripped stars). Our models exhibit a peak at MCO ≈ 7.51 M⊙, which is higher than the value for single and Case C stripped stars. Thus, despite variations in the location of the islands of explodability across different systems, the underlying physical mechanism driving the non-monotonic behavior remains robust across different studies.
 |
Fig. 6. Gravitational masses of NSs, MNS, grav, and BHs, MBH, grav, as a function of both the |

The predicted mass distributions of compact objects plays a critical role in subsequent binary evolution. When the primary star collapses into either a white dwarf (WD), NS, or BH as the first compact object, the subsequent evolution of the secondary star and its interaction with the first compact object can produce various types of compact binary systems. In particular, when He stars with  form WDs or NSs via electron-capture SNe (Woosley 2019). The subsequent evolution of these systems, influenced by the properties of the companion and binary interactions, can result in double WDs, NS-WD binaries, or double NSs systems (e.g., Tauris et al. 2013, 2015, 2017; Wang & Liu 2020; Wang et al. 2022a; Guo et al. 2024). In our models, He stars with initial masses of 5–14 M⊙ and 18–23 M⊙ are expected to successfully explode and leave NS remnants as the first compact objects, while those with masses of 15–17 M⊙ and ≥24 M⊙ fail to explode and directly collapse to form BHs. If the natal kick velocity is insufficient to disrupt the system, the resulting binary configuration comprises a compact object and an OBe-type star. These surviving systems ultimately evolve into observable high-mass X-ray binaries (e.g., Remillard & McClintock 2006; Kretschmar et al. 2019), which are considered strong candidates for BH-BH or BH-NS progenitor systems (Belczynski et al. 2013; Neijssel et al. 2021).
4. Discussion
4.1. Comparison with previous studies
In this work, we adopted He stars as the starting point to study the evolution of stripped-envelope stars. These models provide a physically motivated proxy for the progenitors of Type Ib/c SNe, which are expected to form through either strong stellar winds or binary interactions (e.g., Pols & Dewi 2002; Crowther 2007; Yoon 2017; Woosley 2019; Laplace et al. 2021; Marchant & Bodensteiner 2024). Compared to evolving models from the zero-age main sequence (ZAMS), this approach reduces the uncertainties associated with mass loss during the red supergiant phase and binary interactions (e.g., Smith 2014; Renzo et al. 2017; Marchant & Bodensteiner 2024). Furthermore, in contrast to bare CO core models (e.g., Patton & Sukhbold 2020) which lack the He-shell burning phase and the steep pressure gradient at the boundary of the CO core, He star models allow for a self-consistent treatment of these features. As noted by Patton & Sukhbold (2020), bare CO cores tend to be denser in the center and cooler in the outer parts compared to equivalent cores within He stars. Such structural differences can shift the transition from convective to radiative C burning, thereby altering the islands of explodability (e.g., Sukhbold & Woosley 2014). However, using He stars as a proxy for stripped-envelope stars neglects the residual hydrogen envelope typically retained after binary interactions (e.g., Laplace et al. 2021; Aguilera-Dena et al. 2022). Even a trace amount of hydrogen can alter post-interaction evolution, most notably by triggering significant radial expansion (e.g., Gilkis et al. 2019; Laplace et al. 2020; Dessart et al. 2020).
Several works studied the evolution of He stars as a proxy for stripped-envelope stars, primarily focusing on the nature of their explosion (e.g., Woosley 2019; Ertl et al. 2020; Dessart et al. 2020; Aguilera-Dena et al. 2022, 2023). In this work, we explored the pre-SN core structures of He stars by focusing on several quantities, including final compactness, iron core mass, central entropy, C-free core mass, and binding energy and their correlation with explodability. Although no clear compactness threshold distinguishes between successful and unsuccessful explosions (e.g., Burrows et al. 2020; Takahashi et al. 2023), we found that He stars with a final compactness of ξ2.5 > 0.35 are more likely to form BHs (see Fig. 3). This result is consistent with that of Aguilera-Dena et al. (2023). Moreover, Aguilera-Dena et al. (2023) suggested that most He stars with initial masses ∼35 − 40 M⊙ will produce successful explosions. However, we found that most He stars with initial masses below 24 M⊙ were expected to undergo successful explosions. These differences in the predicted outcomes arise from the different values adopted for the mass-loss rate factor fWR; we used fWR = 1, while their models used fWR = 1.58.
In addition, Ertl et al. (2020) investigated the collapse of solar-metallicity He star models of Woosley (2019), using a neutrino-driven hydrodynamics SN code. These models adopted different mass-loss rates, fWR = 1.0 and fWR = 1.5. They found that for He star models with fWR = 1.0, those with final pre-SN masses between approximately 10 and 12 M⊙ exhibit relatively low compactness values. Similarly low compactness is also exhibited in our models for final pre-SN masses within this range (see Fig. 3). Furthermore, Ertl et al. (2020) suggested that for He stars with final pre-SN masses between 6.5 and 12 M⊙, the evolutionary outcome is a mixture of BHs and NSs, consistent with our results (see Fig. 3). In this work, we did not consider BHs formed by fallback, resulting in no formation of low-mass BHs (see Fig. 6).
Previous studies demonstrated that the explodability of He stars exhibits non-monotonic behavior with initial mass (e.g., Ertl et al. 2020; Aguilera-Dena et al. 2023). However, these studies primarily explored He star explodability criteria and the impact of mass loss and metallicity on pre-SN core structure, which determine SN explosion properties such as remnant masses, nucleosynthesis (e.g., 56Ni yields), and light curves. In this work, we focused on the key physical mechanisms underlying the non-monotonic behavior. We found that the final core structure and explodability are mainly determined by MCO and XC. These quantities served as the initial conditions for the subsequent burning stages, influencing the properties of central C/Ne burning and the locations of convective shells. In particular, the location of the last convective C-burning shell set the mass of the C-free core, which limits the iron core mass and the final compactness.
Notably, Patton & Sukhbold (2020) inferred that models with MCO > 10 M⊙ will be very difficult to explode, based on the simulations of Sukhbold et al. (2016) and Ertl et al. (2020). However, our models show that successful explosions can still occur at slightly higher MCO values (see the black dashed vertical line in Fig. 3a). Specifically, models with  and 23 M⊙ (MCO = 10.30 and 10.74 M⊙, respectively) both yield successful explosions. This result is consistent with the recent study by Maltsev et al. (2025), who also predicted a window of explodability for binary-stripped stars at solar metallicity, extending up to MCO = 13.2 − 15.4 M⊙. Significantly, the criterion of Maltsev et al. (2025) predicts a higher probability of explosion compared to that of the Patton & Sukhbold (2020) and Ertl et al. (2020). This discrepancy likely arises from the treatments of input physics, including convective overshooting, the 12C(α, γ)16O reaction rate, mass-loss rate and metallicity (e.g., Sukhbold & Woosley 2014; Sukhbold et al. 2018; Woosley 2019; Chieffi & Limongi 2020; Aguilera-Dena et al. 2023; Temaj et al. 2024; Maltsev et al. 2025; Long et al. 2026).
We also found that these quantities (i.e., final compactness, iron core mass, central entropy, C-free core mass, and binding energy) all exhibit a similar non-monotonic trend with initial mass (see Fig. 3), which is consistent with previous studies on ZAMS stars (e.g., Schneider et al. 2021, 2023, 2024; Temaj et al. 2024; Laplace et al. 2025). Note that the first compactness peak found in this work, at MCO ≈ 7.51 M⊙, is higher than the corresponding peak in non-stripped stars (e.g., Schneider et al. 2023). This systematic change of the compactness peak toward higher CO core masses, also observed in stripped-envelope stars (e.g., see Fig. 2 in Schneider et al. 2023) and other He star models (e.g., Woosley 2019; Aguilera-Dena et al. 2023; Ertl et al. 2020). This is because these models have a higher central C mass fraction at the end of core He burning than non-stripped stars with the same CO core mass.
4.2. The impact of metallicity on pre-SN core structure
Stellar wind is an important process in massive star evolution, significantly affecting stellar structure and the final fate of a star (Langer 2012; Meynet et al. 2015; Renzo et al. 2017). The mass loss rates of WR stars are strongly metallicity dependent (Crowther 2007; Hainich et al. 2014; Tramper et al. 2016; Sander & Vink 2020). Higher metallicity enhances radiation-driven winds by increasing the opacity of the envelope, resulting in stronger winds and elevated mass-loss rates (Maeder & Meynet 2000; Heger et al. 2003; Langer 2012; Smith 2014; Groh et al. 2019). To explore the impact of metallicity on core structure, we present the evolution of a 15 M⊙ He star with different metallicities using Kippenhahn diagrams (see Fig. B.1). In these models, during core He burning, those with higher metallicity exhibit core characteristics similar to those of lower-mass stars, namely, higher central density and lower central temperature. Additionally, as metallicity increases, enhanced stellar wind mass loss significantly reduces the mass of the convective He-burning core, thereby decreasing the mass of the CO core. According to Eq. (7), these changes result in a slight increase in XC at the end of core He burning (see Table 1), altering the nature of core C burning and triggering multiple convective C-burning shell episodes.
Specifically, in the Z = 0.0088 model, core C burning begins radiatively. After core C depletion, a convective C-burning shell forms. The C-burning front stabilizes at 1.92 M⊙, which is lower than the mass coordinate used for compactness evaluation, remaining at this position until core collapse. This results in a smaller C-free core and an expanded envelope, which limits the growth of the iron core and reduces its compactness (see Table 1). In the Z = 0.02 model (see the top-right panel of Fig. B.1), core C burning still beginning radiative, and two convective C-burning shell episodes are subsequently produced. The location of the last convective C-burning shell exceeds the mass coordinate used to evaluate compactness. As discussed in detail in Section 3.2, the final compactness and iron core mass are relatively high, corresponding to a peak in compactness. In the Z = 0.03 mdoel (see the lower-left panel of Fig. B.1), central C-burning proceeds radiatively and is followed by two successive convective burning shell episodes. In contrast, the Z = 0.04 model exhibits convective C-burning core (the lower-right panel of Fig. B.1), followed by three convective C-burning shell. The radiative core C burning in the Z = 0.03 model drives stronger core contraction, prompting earlier Ne ignition in the core and shifting the C-burning front inward to a lower mass coordinate (∼2.10 M⊙) compared to the Z = 0.04 model (∼2.20 M⊙). In both the Z = 0.03 and Z = 0.04 models, the location of the last convective C-burning shell is lower than the mass coordinate used to evaluate compactness. This leads to a smaller iron core mass and reduced compactness (see Table 1). These results demonstrate that, although MCO and XC show distinct sensitivities to metallicity, their variations shape the pre-SN core structure and explodability. Similarly, Maltsev et al. (2025) also found that the islands of explodability exhibit a dependence on metallicity, shifting systematically toward higher MCO as metallicity increases.
4.3. The impact of convective overshooting on pre-SN core structure
Convective overshooting transports fresh fuel to the burning regions while also moving nuclear reaction products outward. This process not only prolongs the lifetime of each burning phase but also alters the CO core mass and the mass fraction of 12C at the end of He burning, ultimately influencing the final pre-SN core structure (e.g., Langer 2012; Sukhbold & Woosley 2014; Kaiser et al. 2020; Temaj et al. 2024). However, significant uncertainties still exist regarding convection overshooting in He stars. For example, Chanlaridis et al. (2022) and Schneider et al. (2023) emphasized that variations in overshooting significantly influence the final core structure.
To explore the impact of convective overshooting on the pre-SN core structure, we considered four values of fov = 0.0, 0.01, 0.016, and 0.027 (Herwig 2000; Kaiser et al. 2020; Renzo et al. 2020; Higgins et al. 2021; Li & Li 2023). Fig. C.1 shows Kippenhahn diagrams for a  model with these convective overshooting values. In addition, Fig. 7 shows the stellar wind mass loss rate as a function of evolutionary age is displayed for the same models with varying overshooting values. We found that He stars with larger overshooting paradoxically form smaller MCO at central He exhaustion (see Table 1). This phenomenon arises from two competing effects: (1) overshooting mixes fresh He from the envelope into the core, prolonging the lifetime of core He burning. As shown in Fig. 7, models with larger overshooting, such as fov = 0.027, have significantly longer central He-burning lifetimes compared to those with lower or no overshooting; and (2) overshooting also enhances the transport of core He burning products to the surface. Consequently, in models with larger overshooting, the surface helium abundance YS drops more rapidly below the WC/WO transition threshold (YS < 0.9; see Section 2.1 ). The earlier transition from WNE to WC/WO winds (see Fig. 7, where the blue solid line corresponds to the fov = 0.027 model that undergoes the earliest transition) triggers a sharp increase in the mass-loss rate (ṀWC ∝ YS0.44), which suppresses the growth of the CO core. Thus, enhanced overshooting reduces the CO core mass and increases the mass fraction of 12C in He stars. As shown in Table 1, when the overshooting parameter is increased from fov = 0.0 to 0.027, the CO core mass decreases progressively from 7.70 to 7.34 M⊙, while XC increases from 0.253 to 0.256. These small changes lead to a slight decrease in the location of the first convective C-burning shell (see Fig. C.1), thereby causing a reduction in both iron core mass and compactness, although the changes are not significant (see Table 1).
 |
Fig. 7. Rate of stellar wind mass loss as a function of evolutionary age for |

5. Conclusions
In this work, we investigated the evolution of He stars with initial masses from 5 to 65 M⊙ at solar metallicity, focusing on their pre-SN core structures to predict their final fates. We also explored the effects of metallicity and convective boundary mixing on the pre-SN core structure. Our main conclusions are as follows:
(1) Several quantities exhibit similar non-monotonic behaviors with initial mass, such as the final compactness, iron core mass, central entropy, C-free core mass, and binding energy, reflecting their strong correlations. Based on the neutrino-driven SN model of Müller et al. (2016) and the explodability criterion of Ertl et al. (2016), we found that He stars with higher final compactness are more likely to form BHs. The final compactness peaks at initial masses of 15 M⊙ and 30 M⊙, corresponding to CO core masses of 7.51 M⊙ and 13.98 M⊙, respectively.
(2) By following the evolution of compactness with stellar age, we found that this parameter is governed not only by the nature of core C burning (i.e., convective or radiative) but also by the location and strength of the subsequent burning shells. Specifically, when the convective shell is located within the mass coordinate at which we evaluate the compactness, it significantly reduces the compactness. Notably, the location of the last convective C-burning shell is the dominant factor in determining the final compactness.
(3) We found that the final compactness increases with the transition of core C burning from the convective to the radiative regime ( in Fig. 3). This transition indicates that neutrino energy loss exceeds the energy released by core C burning, leading to stronger core contraction and further outward progression of the C-burning front, which yields a larger iron core mass and a higher final compactness. When core Ne burning becomes neutrino-dominated, the same mechanism causes the final compactness to gradually increase again (
 in Fig. 3).
(4) After the compactness peaks, the final compactness decreases with increasing initial mass ( and 30–40 M⊙ in Fig. 3). We found that earlier core Ne/O ignition and shell mergers are key mechanisms driving this decrease. Specifically, when the location of the C-burning front (during the first convective C-burning shell) exceeds the effective Chandrasekhar mass, it triggers the earlier ignition of Ne and O, which slows core contraction. Moreover, when the entropy of the Ne/O-burning shells exceeds that of the layers above, a shell merger occurs, expanding the overlying layers and shifting the burning front to lower mass coordinates. These processes ultimately result in a smaller iron core and a lower final compactness.
(5) We found that metallicity and convective overshooting affect the central 12C mass fraction and CO core mass to different extents, leading to differences in the subsequent core structure. Specifically, higher metallicity significantly decreases the CO core mass and slightly increases the central 12C mass fraction. However, the final compactness does not follow a monotonic trend with metallicity, while the explodability is highly sensitive to metallicity variations. On the other hand, a larger convective overshooting also slightly increases the central 12C mass fraction but only slightly decreases the CO core mass. This leads to a monotonic decline in final compactness with increasing overshooting, but the explodability is not sensitive to changes in overshooting. The influence of these uncertainties on the explodability of progenitors varies significantly.
Acknowledgments
This study is supported by the National Natural Science Foundation of China (Nos 12225304, 12288102, 12090040, 12090043, 12403035, 12173010, 12573034, 12273105), the National Key R&D Program of China (No. 2021YFA1600404), the Yunnan Revitalization Talent Support Program (Yunling Scholar Project and Innovation Team Project), the Youth Innovation Promotion Association CAS (No. 2021058), the Yunnan Fundamental Research Project (Nos. 202501AS070005, 202401AV070006, 202501AS070078), ,the International Centre of Supernovae (ICESUN), Yunnan Key Laboratory (No. 202505AV340004), the Postdoctoral Fellowship Program of CPSF (No. GZB20240307), the China Postdoctoral Science Foundation (Nos. 2024M751375, 2024T170393), and the Jiangsu Funding Programme for Excellent Postdoctoral Talent (No. 2024ZB705).
References
- Aguilera-Dena, D. R., Langer, N., Antoniadis, J., et al. 2022, A&A, 661, A60 [NASA ADS] [CrossRef] [EDP Sciences] [Google Scholar]
- Aguilera-Dena, D. R., Müller, B., Antoniadis, J., et al. 2023, A&A, 671, A134 [NASA ADS] [CrossRef] [EDP Sciences] [Google Scholar]
- Angulo, C., Arnould, M., Rayet, M., et al. 1999, Nucl. Phys. A, 656, 3 [Google Scholar]
- Baron, E., & Cooperstein, J. 1990, ApJ, 353, 597 [NASA ADS] [CrossRef] [Google Scholar]
- Belczynski, K., Bulik, T., Mandel, I., et al. 2013, ApJ, 764, 96 [NASA ADS] [CrossRef] [Google Scholar]
- Boccioli, L., Roberti, L., Limongi, M., Mathews, G. J., & Chieffi, A. 2023, ApJ, 949, 17 [CrossRef] [Google Scholar]
- Böhm-Vitense, E. 1958, Z. Astrophys., 46, 108 [Google Scholar]
- Brown, G. E., Heger, A., Langer, N., et al. 2001, New Astron., 6, 457 [NASA ADS] [CrossRef] [Google Scholar]
- Burrows, A., Radice, D., Vartanyan, D., et al. 2020, MNRAS, 491, 2715 [NASA ADS] [CrossRef] [Google Scholar]
- Burrows, A., & Vartanyan, D. 2021, Nature, 589, 29 [CrossRef] [PubMed] [Google Scholar]
- Burrows, A., Vartanyan, D., & Wang, T. 2023, ApJ, 957, 68 [NASA ADS] [CrossRef] [Google Scholar]
- Chanlaridis, S., Antoniadis, J., Aguilera-Dena, D. R., et al. 2022, A&A, 668, A106 [NASA ADS] [CrossRef] [EDP Sciences] [Google Scholar]
- Chen, X., Liu, Z., & Han, Z. 2024, Progr. Part. Nucl. Phys., 134, 104083 [Google Scholar]
- Chieffi, A., & Limongi, M. 2020, ApJ, 890, 43 [NASA ADS] [CrossRef] [Google Scholar]
- Chieffi, A., Roberti, L., Limongi, M., et al. 2021, ApJ, 916, 79 [NASA ADS] [CrossRef] [Google Scholar]
- Collins, C., Müller, B., & Heger, A. 2018, MNRAS, 473, 1695 [NASA ADS] [Google Scholar]
- Couch, S. M., Warren, M. L., & O’Connor, E. P. 2020, ApJ, 890, 127 [NASA ADS] [CrossRef] [Google Scholar]
- Crowther, P. A. 2007, ARA&A, 45, 177 [Google Scholar]
- Davis, A., Jones, S., & Herwig, F. 2019, MNRAS, 484, 3921 [NASA ADS] [CrossRef] [Google Scholar]
- deBoer, R. J., Görres, J., Wiescher, M., et al. 2017, Rev. Mod. Phys., 89, 035007 [NASA ADS] [CrossRef] [Google Scholar]
- Dessart, L., Yoon, S.-C., Aguilera-Dena, D. R., & Langer, N. 2020, A&A, 642, A106 [NASA ADS] [CrossRef] [EDP Sciences] [Google Scholar]
- Ertl, T., Janka, H. T., Woosley, S. E., Sukhbold, T., & Ugliano, M. 2016, ApJ, 818, 124 [NASA ADS] [CrossRef] [Google Scholar]
- Ertl, T., Woosley, S. E., Sukhbold, T., & Janka, H. T. 2020, ApJ, 890, 51 [CrossRef] [Google Scholar]
- Foglizzo, T., Kazeroni, R., Guilet, J., et al. 2015, PASA, 32, e009 [NASA ADS] [CrossRef] [Google Scholar]
- Fryer, C. L., Heger, A., Langer, N., & Wellstein, S. 2002, ApJ, 578, 335 [Google Scholar]
- Fryer, C. L., Belczynski, K., Wiktorowicz, G., et al. 2012, ApJ, 749, 91 [Google Scholar]
- Gilkis, A., Vink, J. S., Eldridge, J. J., & Tout, C. A. 2019, MNRAS, 486, 4451 [CrossRef] [Google Scholar]
- Groh, J. H., Ekström, S., Georgy, C., et al. 2019, A&A, 627, A24 [NASA ADS] [CrossRef] [EDP Sciences] [Google Scholar]
- Guo, Y.-L., Wang, B., Chen, W.-C., et al. 2024, MNRAS, 530, 4461 [Google Scholar]
- Hainich, R., Rühling, U., Todt, H., et al. 2014, A&A, 565, A27 [NASA ADS] [CrossRef] [EDP Sciences] [Google Scholar]
- Heger, A., Fryer, C. L., Woosley, S. E., Langer, N., & Hartmann, D. H. 2003, ApJ, 591, 288 [CrossRef] [Google Scholar]
- Heger, A., Müller, B., & Mandel, I. 2024, in The Encyclopedia of Cosmology: Set 2: Frontiers in Cosmology Black Holes (World Scientific), 61 [Google Scholar]
- Herwig, F. 2000, A&A, 360, 952 [NASA ADS] [Google Scholar]
- Higgins, E. R., Sander, A. A. C., Vink, J. S., & Hirschi, R. 2021, MNRAS, 505, 4874 [NASA ADS] [CrossRef] [Google Scholar]
- Kaiser, E. A., Hirschi, R., Arnett, W. D., et al. 2020, MNRAS, 496, 1967 [Google Scholar]
- Klencki, J., Istrate, A., Nelemans, G., & Pols, O. 2022, A&A, 662, A56 [NASA ADS] [CrossRef] [EDP Sciences] [Google Scholar]
- Kretschmar, P., Fürst, F., Sidoli, L., et al. 2019, New Astron. Rev., 86, 101546 [Google Scholar]
- Langer, N. 2012, ARA&A, 50, 107 [CrossRef] [Google Scholar]
- Laplace, E., Götberg, Y., de Mink, S. E., Justham, S., & Farmer, R. 2020, A&A, 637, A6 [NASA ADS] [CrossRef] [EDP Sciences] [Google Scholar]
- Laplace, E., Justham, S., Renzo, M., et al. 2021, A&A, 656, A58 [NASA ADS] [CrossRef] [EDP Sciences] [Google Scholar]
- Laplace, E., Schneider, F. R. N., & Podsiadlowski, P. 2025, A&A, 695, A71 [NASA ADS] [CrossRef] [EDP Sciences] [Google Scholar]
- Li, Z., & Li, Y. 2023, ApJS, 268, 51 [Google Scholar]
- Long, G., Wang, Y., Liu, D., Wang, J., & Wang, B. 2026, Res. Astron. Astrophys., 26, 015020 [Google Scholar]
- Maeder, A., & Meynet, G. 2000, ARA&A, 38, 143 [Google Scholar]
- Maltsev, K., Schneider, F. R. N., Mandel, I., et al. 2025, A&A, 700, A20 [NASA ADS] [CrossRef] [EDP Sciences] [Google Scholar]
- Marchant, P., & Bodensteiner, J. 2024, ARA&A, 62, 21 [NASA ADS] [CrossRef] [Google Scholar]
- Marchant, P., Renzo, M., Farmer, R., et al. 2019, ApJ, 882, 36 [Google Scholar]
- McClelland, L. A. S., & Eldridge, J. J. 2016, MNRAS, 459, 1505 [NASA ADS] [CrossRef] [Google Scholar]
- Meynet, G., Chomienne, V., Ekström, S., et al. 2015, A&A, 575, A60 [NASA ADS] [CrossRef] [EDP Sciences] [Google Scholar]
- Moe, M., & Di Stefano, R. 2017, ApJS, 230, 15 [Google Scholar]
- Müller, B., Heger, A., Liptai, D., & Cameron, J. B. 2016, MNRAS, 460, 742 [Google Scholar]
- Neijssel, C. J., Vinciguerra, S., Vigna-Gómez, A., et al. 2021, ApJ, 908, 118 [NASA ADS] [CrossRef] [Google Scholar]
- O’Connor, E., & Ott, C. D. 2011, ApJ, 730, 70 [Google Scholar]
- Patton, R. A., & Sukhbold, T. 2020, MNRAS, 499, 2803 [NASA ADS] [CrossRef] [Google Scholar]
- Patton, R. A., Sukhbold, T., & Eldridge, J. J. 2022, MNRAS, 511, 903 [NASA ADS] [CrossRef] [Google Scholar]
- Paxton, B., Bildsten, L., Dotter, A., et al. 2011, ApJS, 192, 3 [Google Scholar]
- Paxton, B., Cantiello, M., Arras, P., et al. 2013, ApJS, 208, 4 [Google Scholar]
- Paxton, B., Marchant, P., Schwab, J., et al. 2015, ApJS, 220, 15 [Google Scholar]
- Paxton, B., Schwab, J., Bauer, E. B., et al. 2018, ApJS, 234, 34 [NASA ADS] [CrossRef] [Google Scholar]
- Paxton, B., Smolec, R., Schwab, J., et al. 2019, ApJS, 243, 10 [Google Scholar]
- Podsiadlowski, P., Joss, P. C., & Hsu, J. J. L. 1992, ApJ, 391, 246 [Google Scholar]
- Pols, O. R., & Dewi, J. D. M. 2002, PASA, 19, 233 [NASA ADS] [CrossRef] [Google Scholar]
- Remillard, R. A., & McClintock, J. E. 2006, ARA&A, 44, 49 [Google Scholar]
- Renzo, M., Ott, C. D., Shore, S. N., & de Mink, S. E. 2017, A&A, 603, A118 [NASA ADS] [CrossRef] [EDP Sciences] [Google Scholar]
- Renzo, M., Farmer, R., Justham, S., et al. 2020, A&A, 640, A56 [NASA ADS] [CrossRef] [EDP Sciences] [Google Scholar]
- Sana, H., de Mink, S. E., de Koter, A., et al. 2012, Science, 337, 444 [Google Scholar]
- Sander, A. A. C., & Vink, J. S. 2020, MNRAS, 499, 873 [Google Scholar]
- Schneider, F. R. N., Podsiadlowski, P., & Müller, B. 2021, A&A, 645, A5 [NASA ADS] [CrossRef] [EDP Sciences] [Google Scholar]
- Schneider, F. R. N., Podsiadlowski, P., & Laplace, E. 2023, ApJ, 950, L9 [NASA ADS] [CrossRef] [Google Scholar]
- Schneider, F. R. N., Podsiadlowski, P., & Laplace, E. 2024, A&A, 686, A45 [NASA ADS] [CrossRef] [EDP Sciences] [Google Scholar]
- Smith, N. 2014, ARA&A, 52, 487 [NASA ADS] [CrossRef] [Google Scholar]
- Song, H. F., Meynet, G., Maeder, A., Ekström, S., & Eggenberger, P. 2016, A&A, 585, A120 [NASA ADS] [CrossRef] [EDP Sciences] [Google Scholar]
- Sukhbold, T., & Adams, S. 2020, MNRAS, 492, 2578 [Google Scholar]
- Sukhbold, T., & Woosley, S. E. 2014, ApJ, 783, 10 [NASA ADS] [CrossRef] [Google Scholar]
- Sukhbold, T., Ertl, T., Woosley, S. E., Brown, J. M., & Janka, H. T. 2016, ApJ, 821, 38 [NASA ADS] [CrossRef] [Google Scholar]
- Sukhbold, T., Woosley, S. E., & Heger, A. 2018, ApJ, 860, 93 [NASA ADS] [CrossRef] [Google Scholar]
- Suwa, Y., Yoshida, T., Shibata, M., Umeda, H., & Takahashi, K. 2018, MNRAS, 481, 3305 [NASA ADS] [CrossRef] [Google Scholar]
- Takahashi, K., Takiwaki, T., & Yoshida, T. 2023, ApJ, 945, 19 [NASA ADS] [CrossRef] [Google Scholar]
- Tauris, T. M., Sanyal, D., Yoon, S. C., & Langer, N. 2013, A&A, 558, A39 [NASA ADS] [CrossRef] [EDP Sciences] [Google Scholar]
- Tauris, T. M., Langer, N., & Podsiadlowski, P. 2015, MNRAS, 451, 2123 [NASA ADS] [CrossRef] [Google Scholar]
- Tauris, T. M., Kramer, M., Freire, P. C. C., et al. 2017, ApJ, 846, 170 [Google Scholar]
- Temaj, D., Schneider, F. R. N., Laplace, E., Wei, D., & Podsiadlowski, P. 2024, A&A, 682, A123 [NASA ADS] [CrossRef] [EDP Sciences] [Google Scholar]
- Timmes, F. X., Woosley, S. E., & Weaver, T. A. 1996, ApJ, 457, 834 [NASA ADS] [CrossRef] [Google Scholar]
- Tramper, F., Sana, H., & de Koter, A. 2016, ApJ, 833, 133 [CrossRef] [Google Scholar]
- Ugliano, M., Janka, H.-T., Marek, A., & Arcones, A. 2012, ApJ, 757, 69 [NASA ADS] [CrossRef] [Google Scholar]
- Wang, B., & Liu, D. 2020, Res. Astron. Astrophys., 20, 135 [CrossRef] [Google Scholar]
- Wang, B., Liu, D., & Chen, H. 2022a, MNRAS, 510, 6011 [Google Scholar]
- Wang, T., Vartanyan, D., Burrows, A., & Coleman, M. S. B. 2022b, MNRAS, 517, 543 [NASA ADS] [CrossRef] [Google Scholar]
- Wang, B., Liu, D., Guo, Y., & Han, Z. 2026, Res. Astron. Astrophys., 26, 032001 [Google Scholar]
- Woosley, S. E. 2019, ApJ, 878, 49 [Google Scholar]
- Woosley, S. E., Heger, A., & Weaver, T. A. 2002, Rev. Mod. Phys., 74, 1015 [NASA ADS] [CrossRef] [Google Scholar]
- Yoon, S.-C. 2017, MNRAS, 470, 3970 [NASA ADS] [CrossRef] [Google Scholar]
- Yoon, S. C., Woosley, S. E., & Langer, N. 2010, ApJ, 725, 940 [NASA ADS] [CrossRef] [Google Scholar]
- Yoon, S. C., Gräfener, G., Vink, J. S., Kozyreva, A., & Izzard, R. G. 2012, A&A, 544, L11 [NASA ADS] [CrossRef] [EDP Sciences] [Google Scholar]
- Zha, S., Müller, B., Weir, A., & Heger, A. 2023, ApJ, 952, 155 [NASA ADS] [CrossRef] [Google Scholar]
Appendix A: Detailed model properties
Initial configurations and pre-SN properties of our default models.
Appendix B: The impact of metallicity on pre-SN core structure
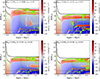 |
Fig. B.1. Same as Fig. 1, but for a |

Appendix C: The impact of convective overshooting on pre-SN core structure
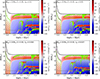 |
Fig. C.1. Same as Fig. 1, but for a |

Appendix D: Electron degeneracy parameter
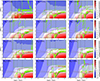 |
Fig. D.1. Same as Fig. 5, but the color bar represents the dimensionless electron degeneracy parameter, as described in panel (d) of Fig. 1. |
All Tables
All Figures
|
Fig. 1. Evolutionary track of a 15 M⊙ He star with solar metallicity (Z = 0.02) and overshooting parameter fov = 0.01. Panel (a): temporal evolution of the compactness parameter ξ2.5 until seconds before core collapse. Key evolutionary phases are marked as follows: pentagram (central He depletion), square (central C ignition), triangle (central C depletion), cross (central Ne depletion), open circle (central O depletion), and left-pointing triangle (central Si depletion). Panel (b): Kippenhahn diagram from core He-burning to the onset of core collapse. The color bar shows the nuclear energy generation rate (ϵnuc, red) and neutrino loss rate (ϵν, blue). The green, purple, and red-hatched regions represent the convective, overshooting, and semiconvective mixing regions, respectively. The gray solid indicate the classical Chandrasekhar mass, MCh, 0, as defined in Eq. (6). The dashed black, dotted red, and dash-dotted magenta lines denote the iron, He-free (MHe-free), and C-free (MC-free) cores, respectively. Vertical dotted lines mark specific depletion and ignition events. Panel (c): same as panel (b), but the color represents the specific gravothermal energy, ϵgrav ≡ −Tds/dt (red: contraction , blue: expansion). Panel (d): same as panel (b), but the color represents the electron degeneracy parameter, η ≡ μ/kBT, where μ is the chemical potential, kB is the Boltzmann constant, and T is temperature. η ≪ −1: non-degenerate; η ≈ 0: partial degeneracy; η ≫ 1: strong degeneracy. |
| In the text | |
|
Fig. 2. Same model as Fig. 1. The figure shows the core structure of the progenitor at the onset of core collapse. Panel (a): radial infall velocity (black dotted line, left axis) and mass fraction profiles of 56Fe, 28Si, and 16O (dashed lines, right axis) versus the mass coordinate Mr. Panel (b): radial profiles of the central density (dashed line) and specific entropy (dotted line) as functions of the mass coordinate Mr, where the iron core mass is 1.85 M⊙. The dash-dotted blue line marks the mass coordinate where the central specific entropy sc = 4 kB, corresponding to the Si/O shell interface at Mr = 2.32 M⊙. |
| In the text | |
|
Fig. 3. Key parameters at the onset of core collapse. Panel (a): final compactness parameter ξ2.5. Panel (b): central specific entropy sc. Panel (c): iron core mass MFe. Panel (d): binding energy above the iron core Ebind. Panel (e): C-free core mass MC-free, all plotted as functions of the initial helium star mass |
| In the text | |
|
Fig. 4. Core properties at the end of core He burning as a function of initial mass. Panel (a): central density ρc and CO core mass MCO at the end of core He burning, shown as a function of the initial He star mass |
| In the text | |
|
Fig. 5. Same as Fig. 1b, but for models with |
| In the text | |
|
Fig. 6. Gravitational masses of NSs, MNS, grav, and BHs, MBH, grav, as a function of both the |
| In the text | |
|
Fig. 7. Rate of stellar wind mass loss as a function of evolutionary age for |
| In the text | |
|
Fig. B.1. Same as Fig. 1, but for a |
| In the text | |
|
Fig. C.1. Same as Fig. 1, but for a |
| In the text | |
|
Fig. D.1. Same as Fig. 5, but the color bar represents the dimensionless electron degeneracy parameter, as described in panel (d) of Fig. 1. |
| In the text | |
Current usage metrics show cumulative count of Article Views (full-text article views including HTML views, PDF and ePub downloads, according to the available data) and Abstracts Views on Vision4Press platform.
Data correspond to usage on the plateform after 2015. The current usage metrics is available 48-96 hours after online publication and is updated daily on week days.
Initial download of the metrics may take a while.