Fig. 2.
Download original image
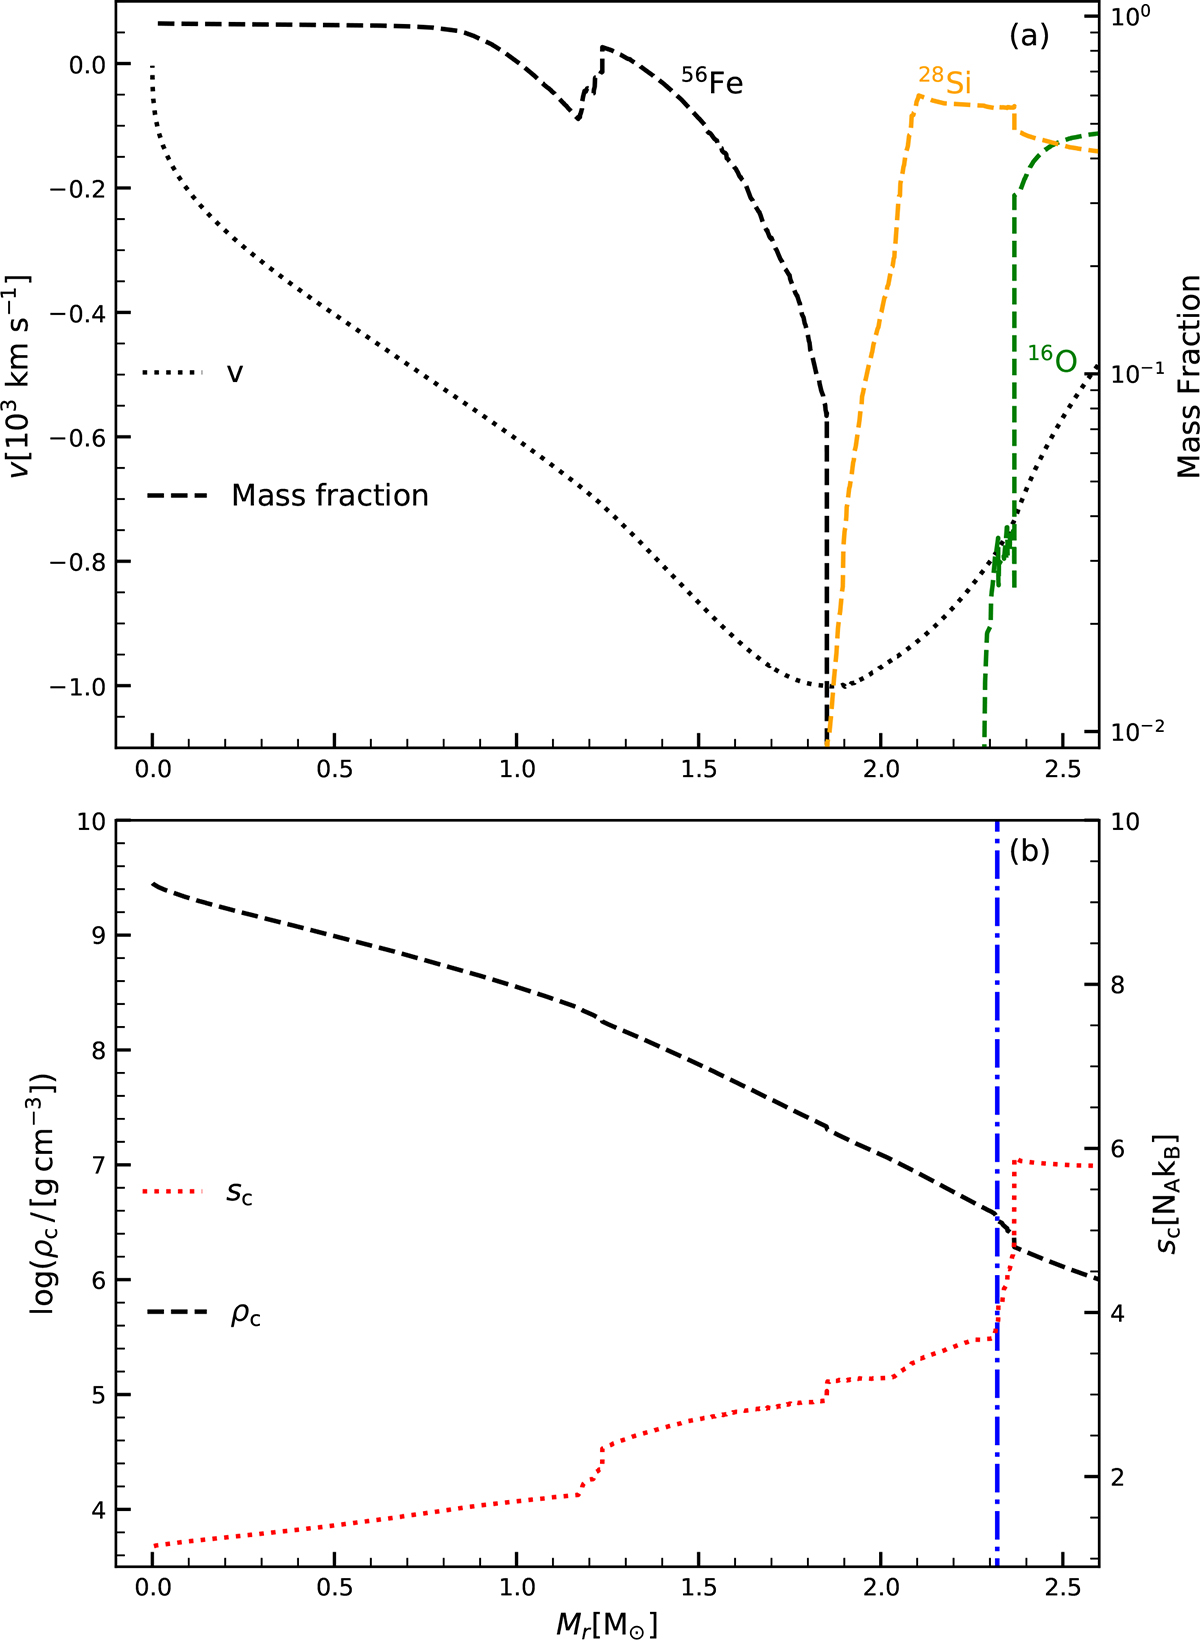
Same model as Fig. 1. The figure shows the core structure of the progenitor at the onset of core collapse. Panel (a): radial infall velocity (black dotted line, left axis) and mass fraction profiles of 56Fe, 28Si, and 16O (dashed lines, right axis) versus the mass coordinate Mr. Panel (b): radial profiles of the central density (dashed line) and specific entropy (dotted line) as functions of the mass coordinate Mr, where the iron core mass is 1.85 M⊙. The dash-dotted blue line marks the mass coordinate where the central specific entropy sc = 4 kB, corresponding to the Si/O shell interface at Mr = 2.32 M⊙.
Current usage metrics show cumulative count of Article Views (full-text article views including HTML views, PDF and ePub downloads, according to the available data) and Abstracts Views on Vision4Press platform.
Data correspond to usage on the plateform after 2015. The current usage metrics is available 48-96 hours after online publication and is updated daily on week days.
Initial download of the metrics may take a while.