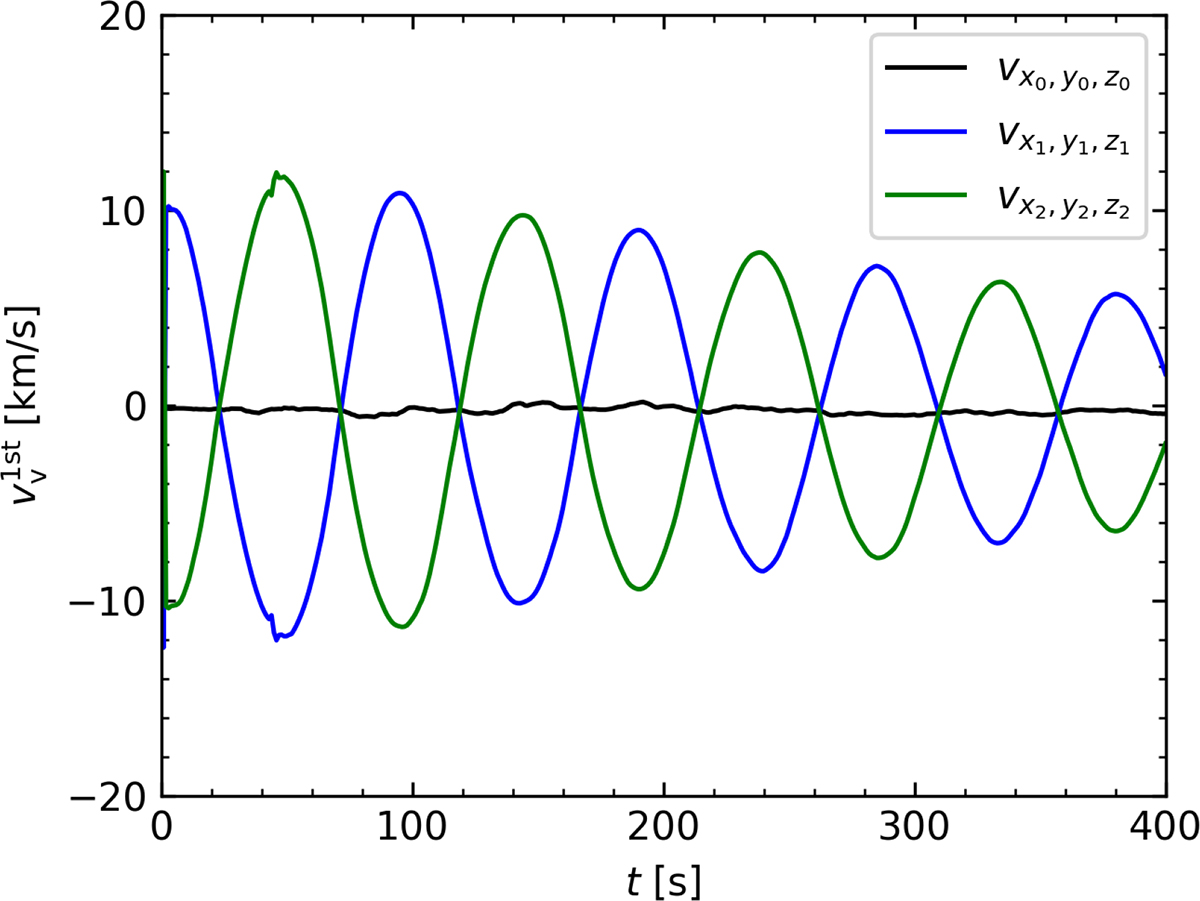
Fig. 4.
Download original image
Temporal evolution of vv for the vertically polarized first overtones of kink oscillations. The black, blue, and green lines represent vv of fluid parcels initially located at the loop apex ([x0, y0, z0]=[0, 0, 70] Mm), at one quarter of the loop ([x1, y1, z1]=[59.4, 0, 49.4] Mm), and at the opposite quarter of the loop ([x2, y2, z2]=[−59.4, 0, 49.4] Mm), respectively.
Current usage metrics show cumulative count of Article Views (full-text article views including HTML views, PDF and ePub downloads, according to the available data) and Abstracts Views on Vision4Press platform.
Data correspond to usage on the plateform after 2015. The current usage metrics is available 48-96 hours after online publication and is updated daily on week days.
Initial download of the metrics may take a while.