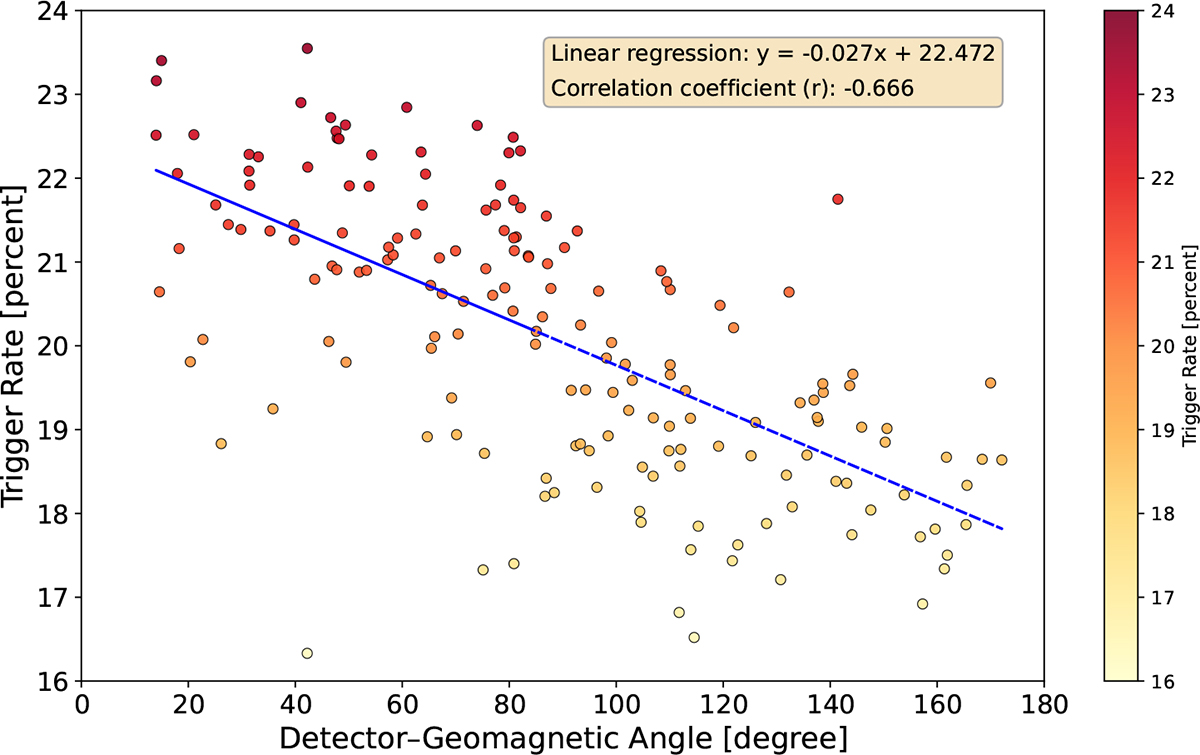
Fig. 11.
Download original image
Relationship between detector trigger rates and magnetic field line orientation. The x-axis represents the angle between GRDs and magnetic field lines, while the y-axis represents the GRD trigger rates. The blue line shows the least-squares fit, with the fitting function and correlation coefficient displayed in the upper right corner (where r denotes the strength of the linear relationship between the two variables).
Current usage metrics show cumulative count of Article Views (full-text article views including HTML views, PDF and ePub downloads, according to the available data) and Abstracts Views on Vision4Press platform.
Data correspond to usage on the plateform after 2015. The current usage metrics is available 48-96 hours after online publication and is updated daily on week days.
Initial download of the metrics may take a while.