Fig. 17.
Download original image
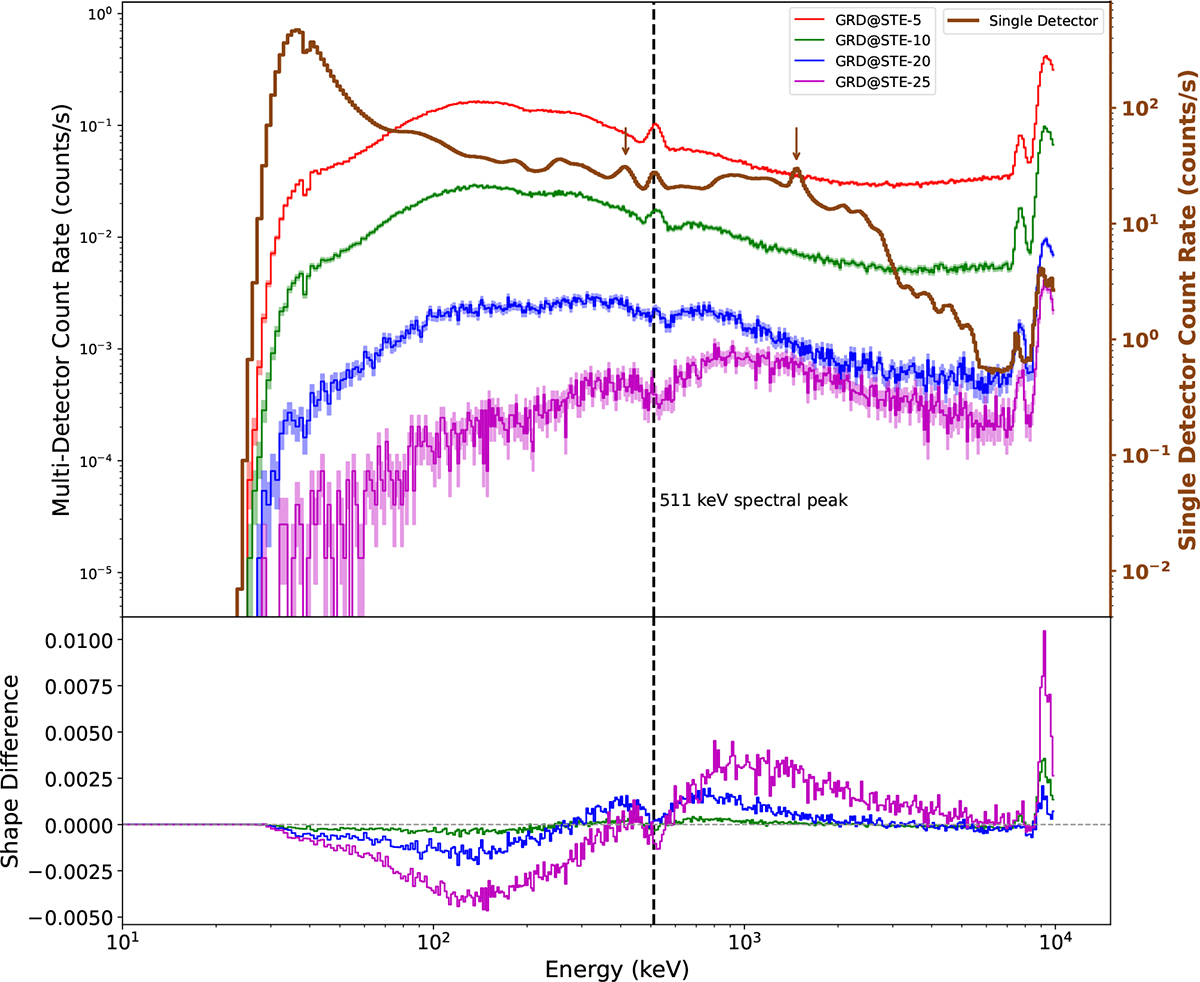
Schematic diagram showing the evolution of single detector event spectra and STE spectra. The brown line represents the single detector event spectrum, corresponding to the right-hand vertical axis. From left to right, the two brown arrows indicate delayed background and intrinsic background, respectively. The red, green, blue, and magenta spectral lines correspond to STEs involving 5, 10, 20, and 25 detectors, respectively. Lower panel: Spectral-shape variations of STEs involving 10, 20, and 25 detectors, using the STE-5 spectrum as the reference baseline.
Current usage metrics show cumulative count of Article Views (full-text article views including HTML views, PDF and ePub downloads, according to the available data) and Abstracts Views on Vision4Press platform.
Data correspond to usage on the plateform after 2015. The current usage metrics is available 48-96 hours after online publication and is updated daily on week days.
Initial download of the metrics may take a while.