Open Access
Fig. 3.
Download original image
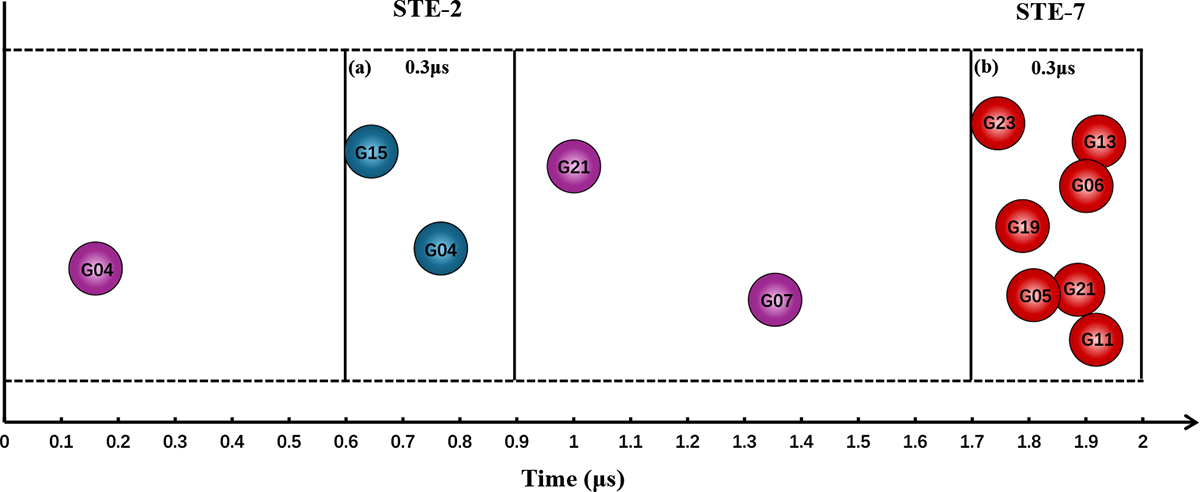
Schematic diagram illustrating STEs. Within a 2 μs interval, two-detector and seven-detector STEs were detected in time windows (a) and (b), respectively. Outside these windows, no events satisfy the simultaneity criterion. Colored spheres indicate the triggered GRDs and their identifiers.
Current usage metrics show cumulative count of Article Views (full-text article views including HTML views, PDF and ePub downloads, according to the available data) and Abstracts Views on Vision4Press platform.
Data correspond to usage on the plateform after 2015. The current usage metrics is available 48-96 hours after online publication and is updated daily on week days.
Initial download of the metrics may take a while.