Fig. 7.
Download original image
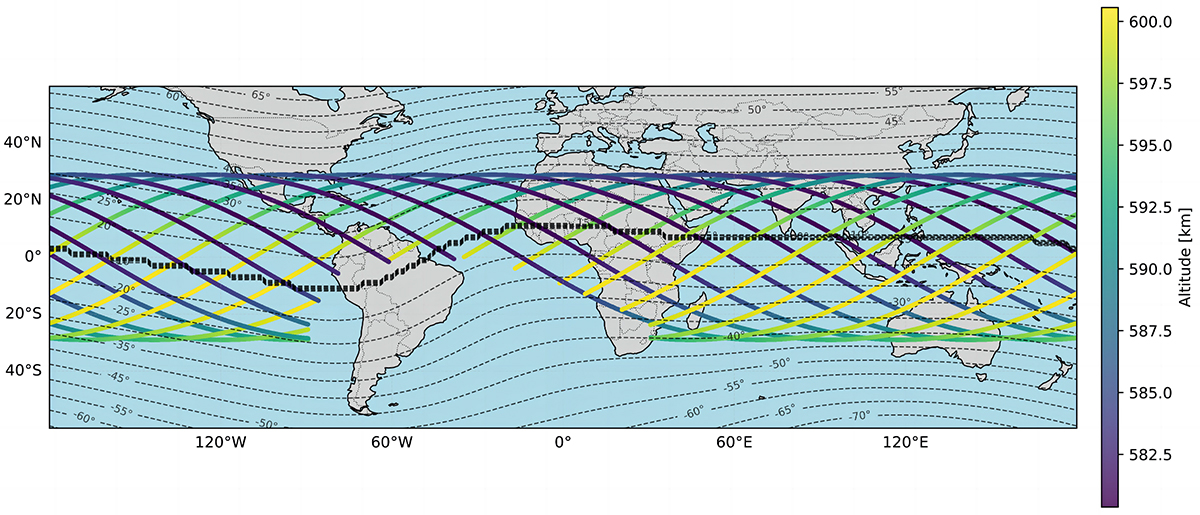
One-day distribution map of subsatellite point trajectories of GECAM-B STEs-5 detected during on-orbit operation, overlaid with geomagnetic latitude. Lines represent the dense one-second scatter along the orbital tracks (excluding the SAA region), colors indicate orbital altitude, and dashed black lines denote geomagnetic latitude contours.
Current usage metrics show cumulative count of Article Views (full-text article views including HTML views, PDF and ePub downloads, according to the available data) and Abstracts Views on Vision4Press platform.
Data correspond to usage on the plateform after 2015. The current usage metrics is available 48-96 hours after online publication and is updated daily on week days.
Initial download of the metrics may take a while.