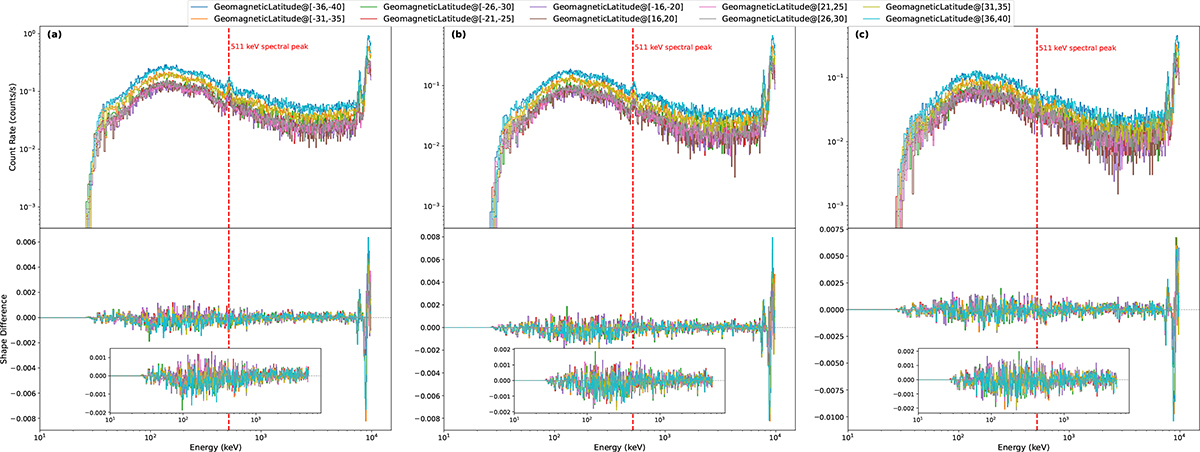
Fig. 8.
Download original image
Energy deposition spectra for the STEs at different geomagnetic latitudes. Panels (a), (b), and (c) correspond to STEs-5, STEs-6, and STEs-7, respectively. Upper panels: Energy deposition spectra of STEs at ten different geomagnetic latitudes. Lower panels: Spectral shape differences. The dashed red line indicates the energy value at 511 keV.
Current usage metrics show cumulative count of Article Views (full-text article views including HTML views, PDF and ePub downloads, according to the available data) and Abstracts Views on Vision4Press platform.
Data correspond to usage on the plateform after 2015. The current usage metrics is available 48-96 hours after online publication and is updated daily on week days.
Initial download of the metrics may take a while.