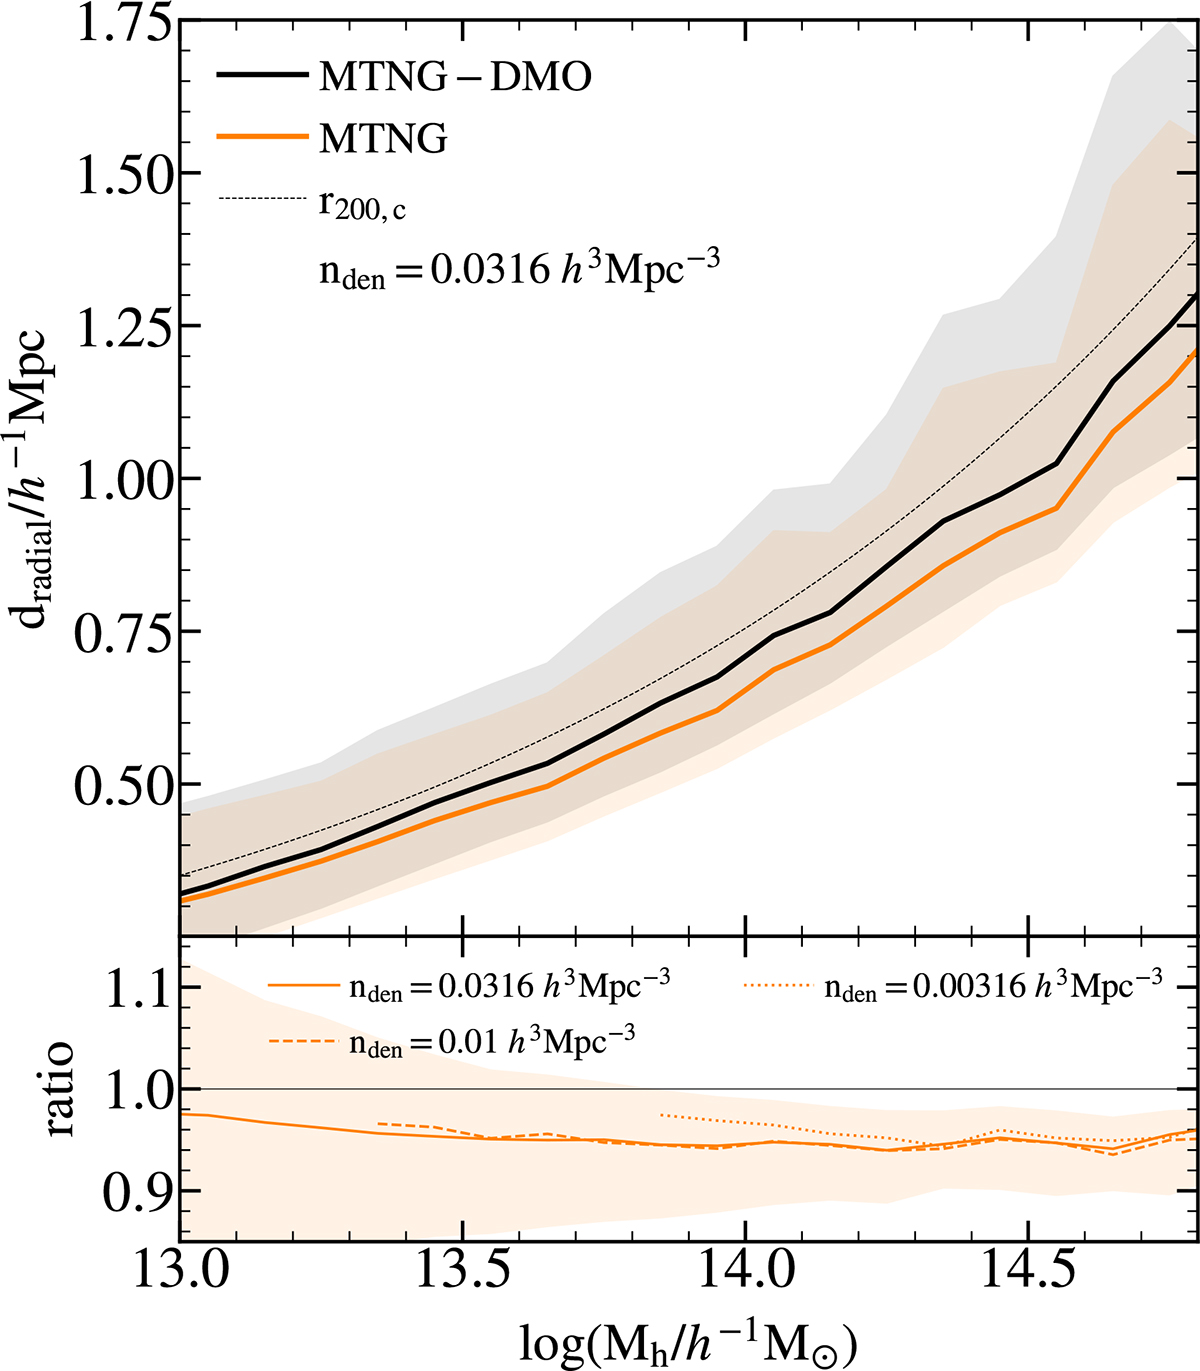
Fig. 2.
Download original image
Top: median (solid lines) and 16th–84th percentile region (shaded area) of the mean radial distance between satellite galaxies and the halo centre as a function of halo mass. Results from the MTNG-DMO simulation are shown in black, and those from the hydrodynamic MTNG run in orange. Subhaloes were selected according to their Vpeak for a number density of nden = 0.0316 h3 Mpc−3 in MTNG-DMO, and the corresponding matched galaxies in MTNG were identified following the procedure described in Section 2.2. Distances are shown as a function of the MTNG-DMO halo masses. The black dashed line represents the value of one virial radius r200c. Bottom: Median (solid lines) and 16th–84th percentile region (shaded area) of the ratio of mean distances between matched haloes in the MTNG and MTNG-DMO simulations. The orange solid line and shaded area correspond to the galaxy sample with number density 0.0316 h3 Mpc−3 (same as in the top panel), while the dashed and dotted lines represent galaxy samples with number densities of 0.01 and 0.00316 h3 Mpc−3. Only the subhaloes successfully matched between the two simulations are shown here.
Current usage metrics show cumulative count of Article Views (full-text article views including HTML views, PDF and ePub downloads, according to the available data) and Abstracts Views on Vision4Press platform.
Data correspond to usage on the plateform after 2015. The current usage metrics is available 48-96 hours after online publication and is updated daily on week days.
Initial download of the metrics may take a while.