Fig. 4.
Download original image
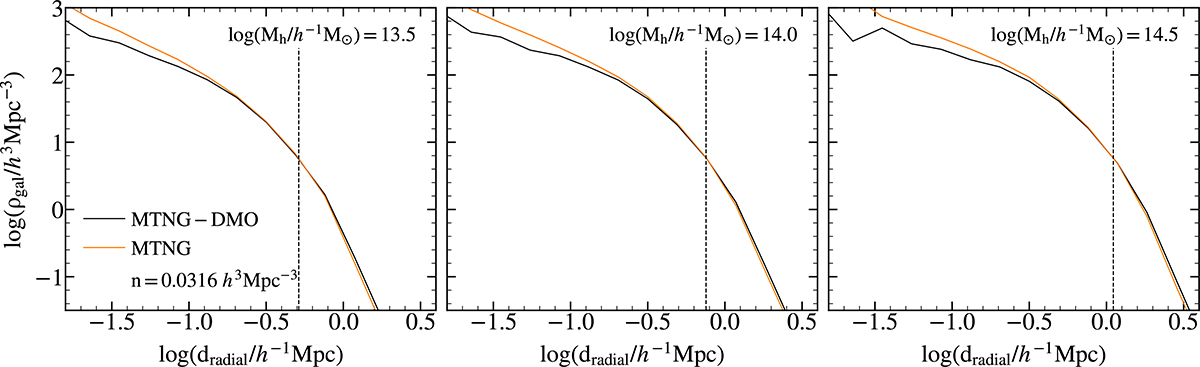
Density of satellite galaxies as a function of distance from the halo centre for the nden = 0.0316 h3 Mpc−3 sample. The left, middle, and right panels show density profiles for halo masses of 1013.5, 1014, and 1014.5 h−1 M⊙, respectively. Black lines represent results from the MTNG-DMO simulation, while orange lines correspond to the hydrodynamic MTNG simulation. The vertical dashed lines represent the value of one virial radius r200c.
Current usage metrics show cumulative count of Article Views (full-text article views including HTML views, PDF and ePub downloads, according to the available data) and Abstracts Views on Vision4Press platform.
Data correspond to usage on the plateform after 2015. The current usage metrics is available 48-96 hours after online publication and is updated daily on week days.
Initial download of the metrics may take a while.