Fig. 7.
Download original image
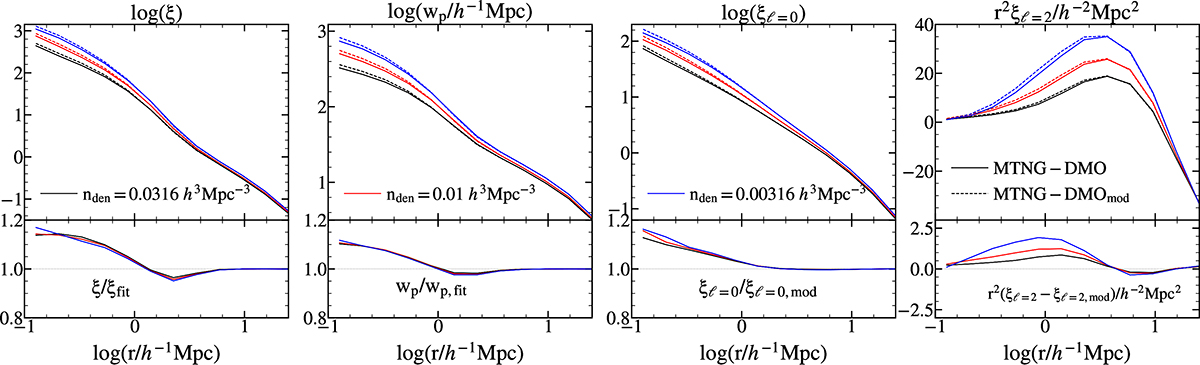
Top: from left to right: the real-space two-point correlation function, the projected correlation function, the monopole, and the quadrupole of the correlation function for samples with number densities of 0.0316 (black lines), 0.01 (red lines), and 0.00316 h3 Mpc−3 (blue lines). Solid lines represent the standard MTNG-DMO samples, while dashed lines correspond to the clustering from the modified MTNG-DMO simulation, where satellite positions and velocities were adjusted to mimic those of the hydrodynamic MTNG run (MTNG-DMOmod). Bottom: ratio of the clustering between MTNG-DMOmod and MTNG-DMO for the two-point, projected, and monopole correlation functions. For the quadrupole (rightmost panel), we show the difference rather than the ratio to avoid discontinuities when the signal crosses zero.
Current usage metrics show cumulative count of Article Views (full-text article views including HTML views, PDF and ePub downloads, according to the available data) and Abstracts Views on Vision4Press platform.
Data correspond to usage on the plateform after 2015. The current usage metrics is available 48-96 hours after online publication and is updated daily on week days.
Initial download of the metrics may take a while.