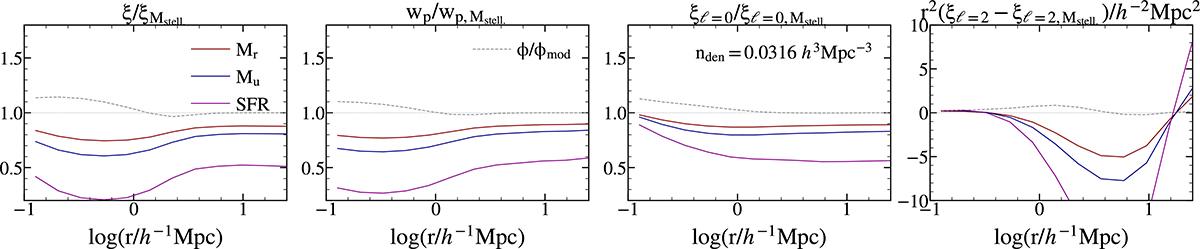
Fig. 8.
Download original image
Ratio and difference in galaxy clustering between galaxies selected by Mr luminosity (dark red lines), Mu luminosity (dark blue lines), and star formation rate (SFR, magenta lines), and those selected by stellar mass in the MTNG simulation. Each galaxy sample has a number density of 0.0316 h3 Mpc−3. For comparison, dashed grey lines show the ratio and difference in clustering between Vpeak-selected subhaloes in the MTNG-DMOmod and MTNG-DMO simulations (ϕ/ϕmod, equivalent to the black solid line in the bottom panel of Fig. 7).
Current usage metrics show cumulative count of Article Views (full-text article views including HTML views, PDF and ePub downloads, according to the available data) and Abstracts Views on Vision4Press platform.
Data correspond to usage on the plateform after 2015. The current usage metrics is available 48-96 hours after online publication and is updated daily on week days.
Initial download of the metrics may take a while.