Fig. 11
Download original image
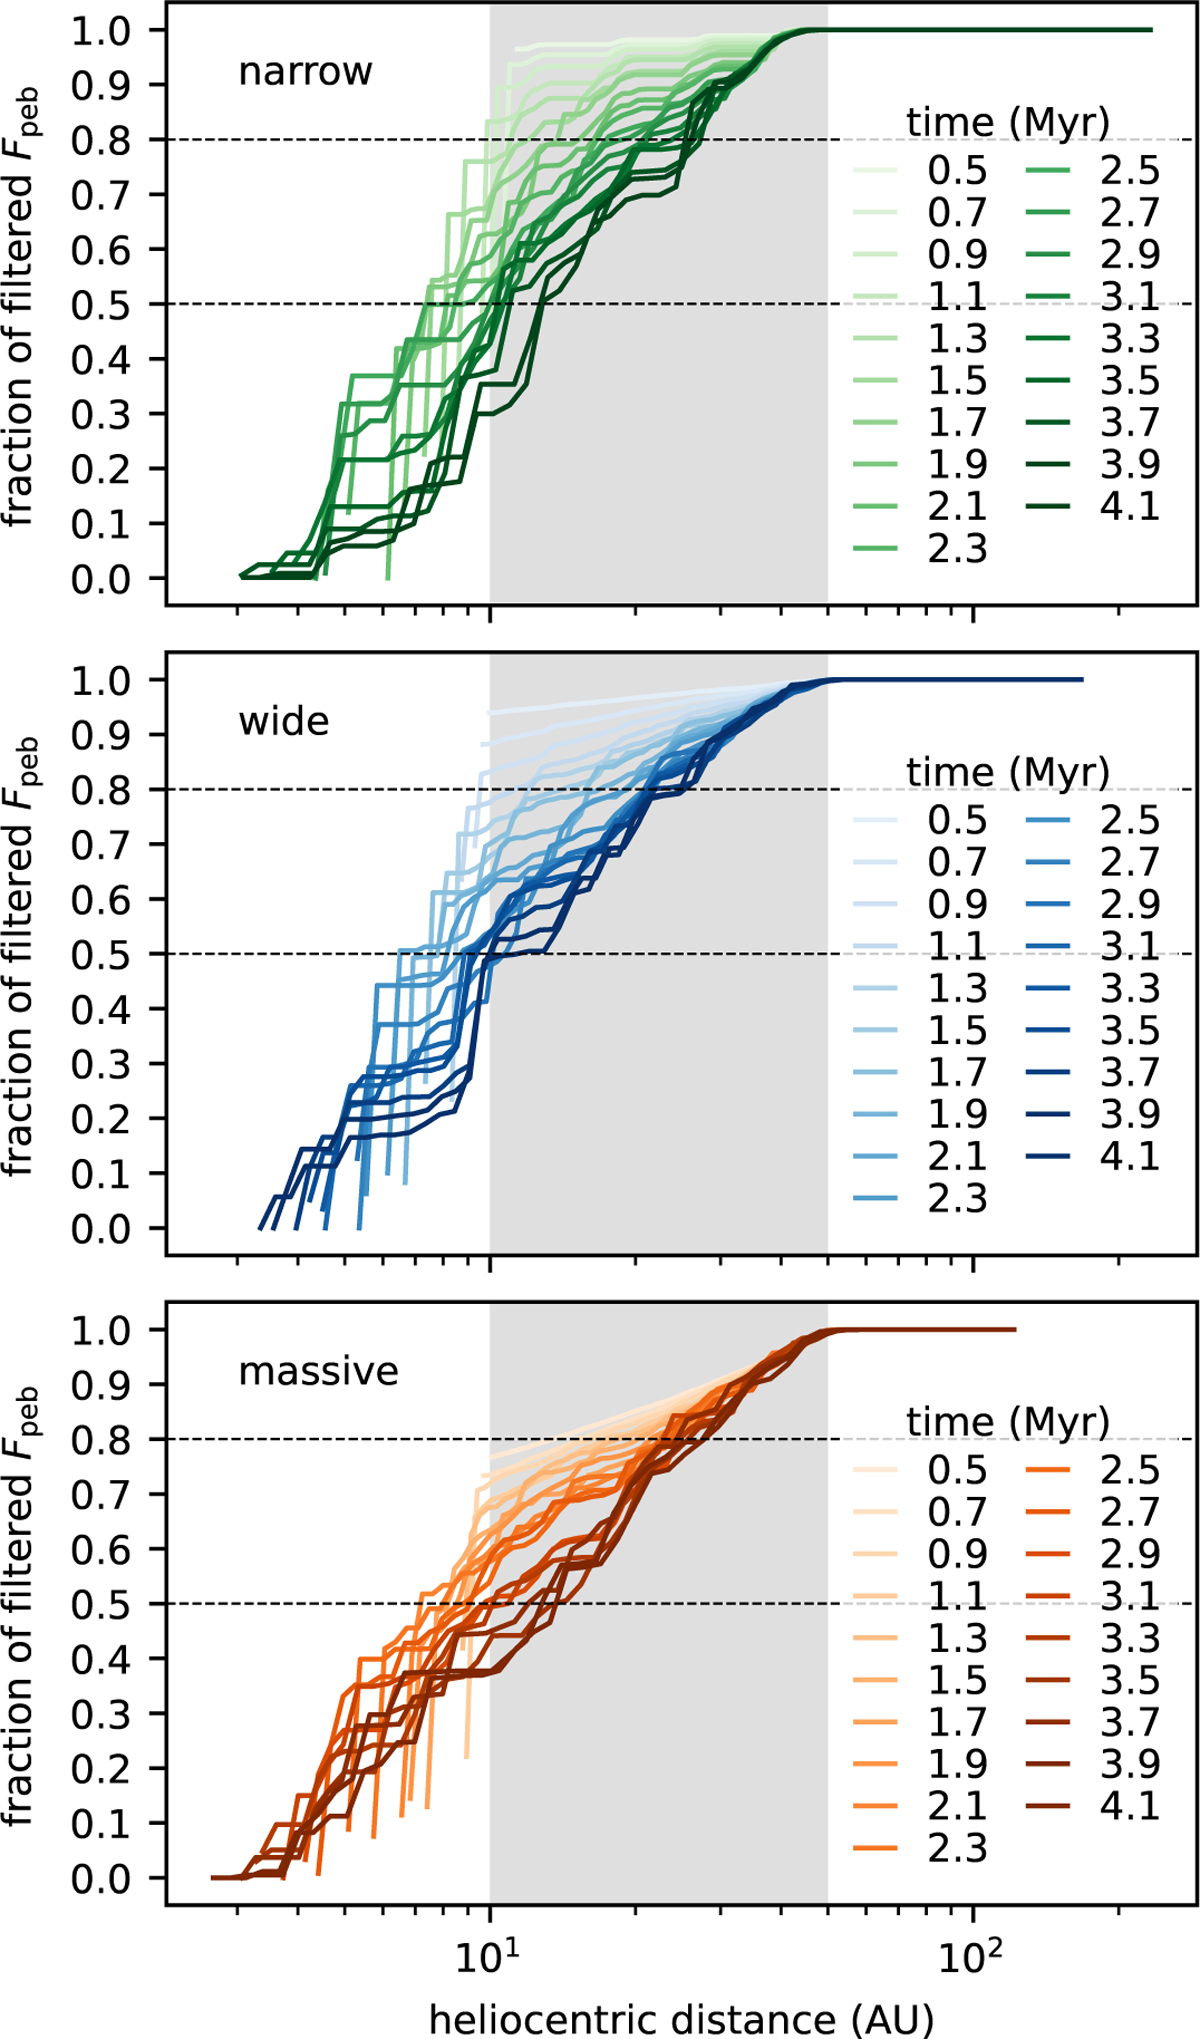
Reduction of the pebble flux through accreting planets. Each line shows the pebble flux in a given heliocentric distance bin at a given time averaged over all simulations for an initial configuration of planetesimals. The panels are as follows: narrow rings (top), wide rings (middle), and high-mass wide rings (bottom). The initial location of the planetesimals (grey area) and the 50 and 80% reduction levels (dashed lines) are shown for reference.
Current usage metrics show cumulative count of Article Views (full-text article views including HTML views, PDF and ePub downloads, according to the available data) and Abstracts Views on Vision4Press platform.
Data correspond to usage on the plateform after 2015. The current usage metrics is available 48-96 hours after online publication and is updated daily on week days.
Initial download of the metrics may take a while.