Fig. 2
Download original image
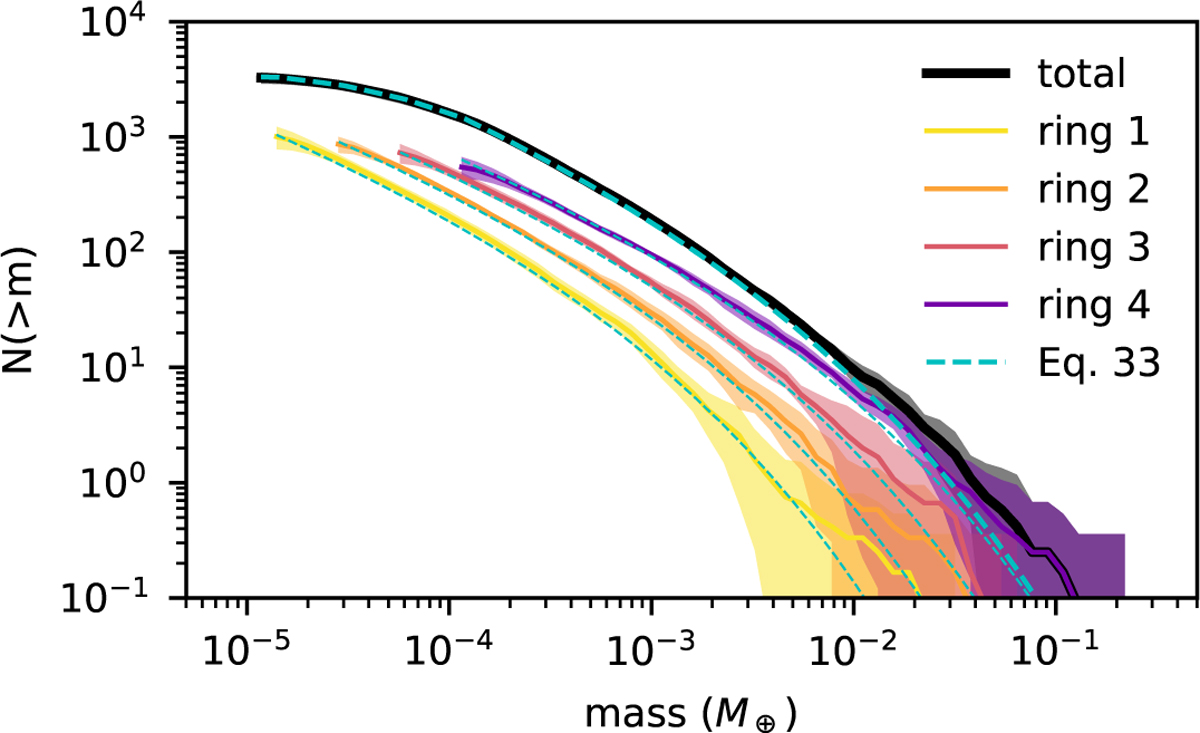
Initial planetesimal mass distribution. We show the initial distributions of the rings (solid coloured lines), the total distribution of all bodies (black), and Eq. (33) (dashed cyan lines). All distributions have been averaged over all low-mass runs. The standard deviation (shaded area) shows the spread of the initial planetesimal mass distribution from the random sampling. The high-mass runs follow the same IMF but with a higher total number of bodies (see also Fig. 8).
Current usage metrics show cumulative count of Article Views (full-text article views including HTML views, PDF and ePub downloads, according to the available data) and Abstracts Views on Vision4Press platform.
Data correspond to usage on the plateform after 2015. The current usage metrics is available 48-96 hours after online publication and is updated daily on week days.
Initial download of the metrics may take a while.