Fig. 3
Download original image
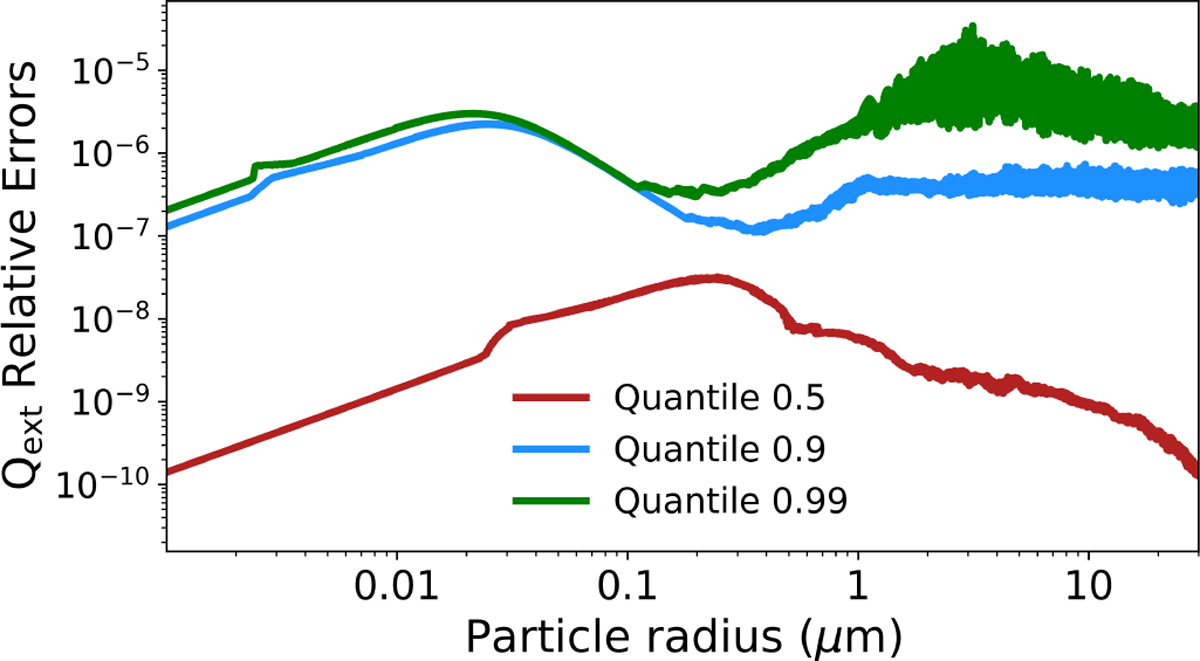
Qext relative error between PYMIESCATT and linear interpolation for each radius interval in the titan tholin grid. For each radius, Qext is computed for 517 wavelengths from 0.3 to 50 microns. The 0.5, 0.9, and 0.99 quantile shown in red, blue, and green, respectively, are computed at each radius from the relative error vs. wavelength array.
Current usage metrics show cumulative count of Article Views (full-text article views including HTML views, PDF and ePub downloads, according to the available data) and Abstracts Views on Vision4Press platform.
Data correspond to usage on the plateform after 2015. The current usage metrics is available 48-96 hours after online publication and is updated daily on week days.
Initial download of the metrics may take a while.