Open Access
Fig. 5
Download original image
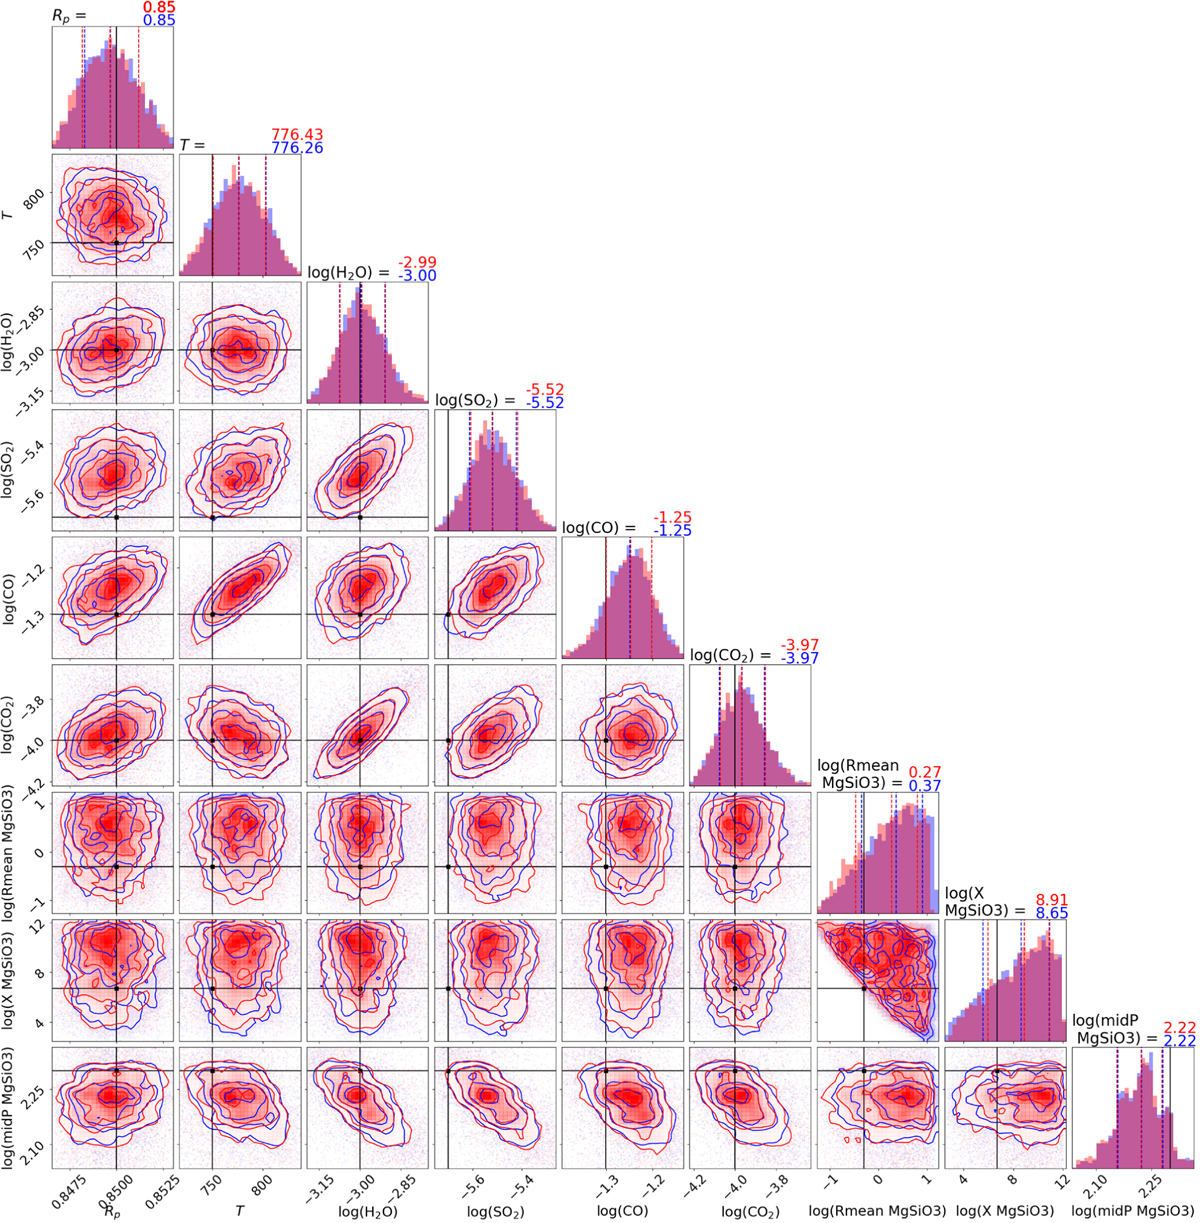
Posterior distributions for WASP 107 b inspired self-retrieval. PYMIESCATT and TAUREX-PCQ are shown in blue and red, respectively. The median value of each retrieved parameter is shown on top of the corresponding histogram. The truth values are displayed in black.
Current usage metrics show cumulative count of Article Views (full-text article views including HTML views, PDF and ePub downloads, according to the available data) and Abstracts Views on Vision4Press platform.
Data correspond to usage on the plateform after 2015. The current usage metrics is available 48-96 hours after online publication and is updated daily on week days.
Initial download of the metrics may take a while.