Fig. 1
Download original image
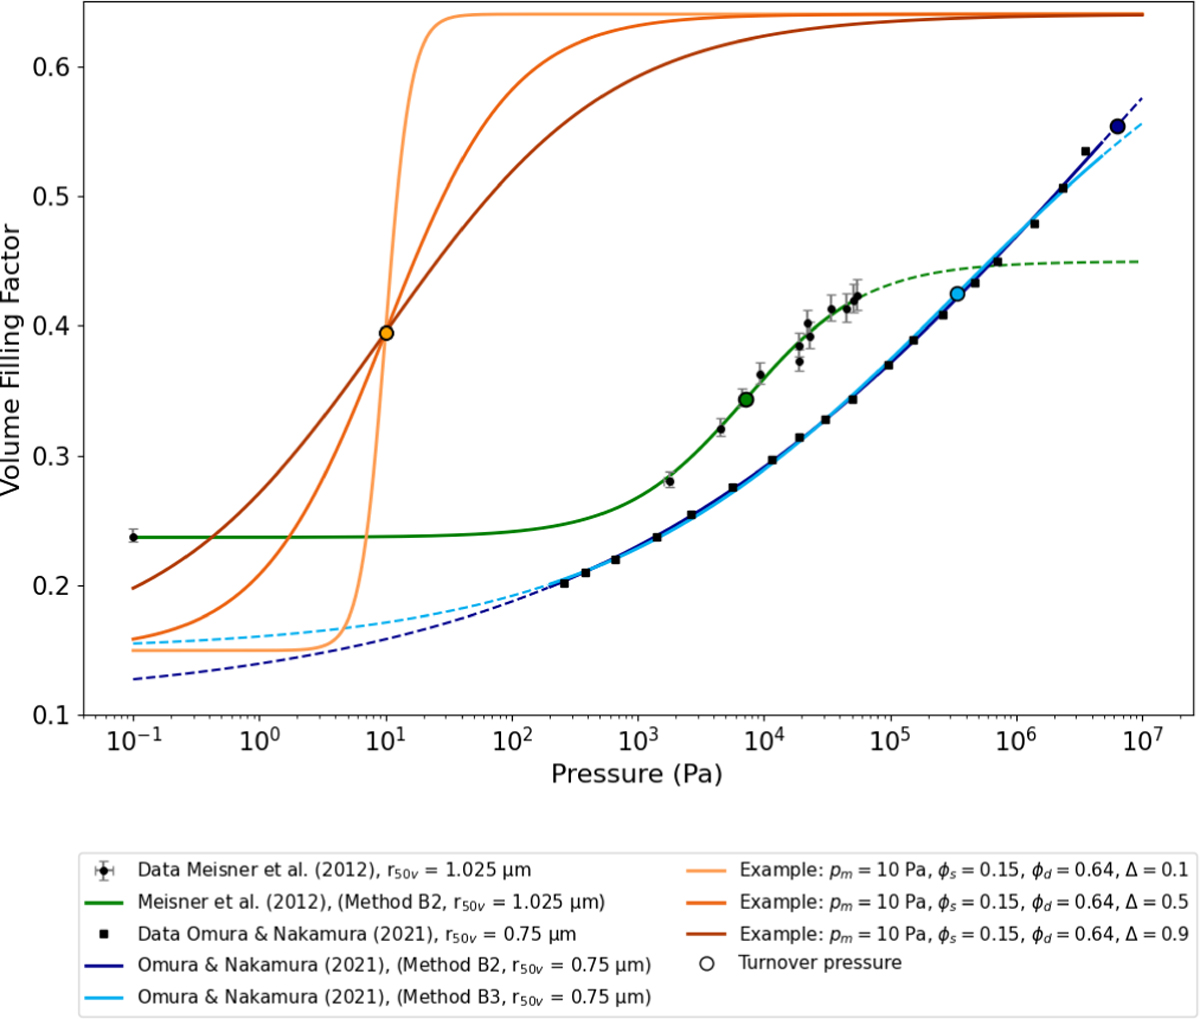
Dependency of the VFF on the compressive stress. The three curves on the left that cross at p = 10 Pa are artificial displays of Eq. (5), each with pm = 10 Pa, φs = 0.15, and φd = 0.64 but with different values of ∆, namely 0.1,0.5, and 0.9, respectively. The two curves on the right are fit functions of Eq. (5) to the data of Meisner et al. (2012) and Omura & Nakamura (2021), respectively. Both datasets were fitted using Method B2, while the data of Omura & Nakamura (2021) were additionally fitted using Method B3 to account for the anomalous increase in VFF observed at pressures above ∼2 ∙ 106 Pa. Solid lines indicate the measured pressure range, whereas dashed lines represent extrapolations of the fitted compression curves beyond the measurement range. All turnover pressures pm are marked by filled circles.
Current usage metrics show cumulative count of Article Views (full-text article views including HTML views, PDF and ePub downloads, according to the available data) and Abstracts Views on Vision4Press platform.
Data correspond to usage on the plateform after 2015. The current usage metrics is available 48-96 hours after online publication and is updated daily on week days.
Initial download of the metrics may take a while.